Navigate the Legacy Reports
Please note: Reports are included with the Blackbelt and Master plans. If you’re a Grasshopper subscriber, upgrade now to gain instant access to these powerful reports.
💡 Please bear in mind: This article is about our legacy reports. Our legacy reports are about to retire soon. Please have a look at our new reports here.
What has changed in reports
Standard reports – Dive straight into ready-made insights.
Group data by custom fields – See data by team, region, or any field you’ve created.
Share custom reports – Collaborate with your team effortlessly.
Visual utilization bars – Spot capacity trends at a glance.
Date range text input – Set custom ranges faster.
Full data export
Includes derived time fields (week number, month, year, etc.) for easier analysis.
Includes adding XLS pack back into the export pack.
Improved filters – Find the right people, clients, and projects more quickly.
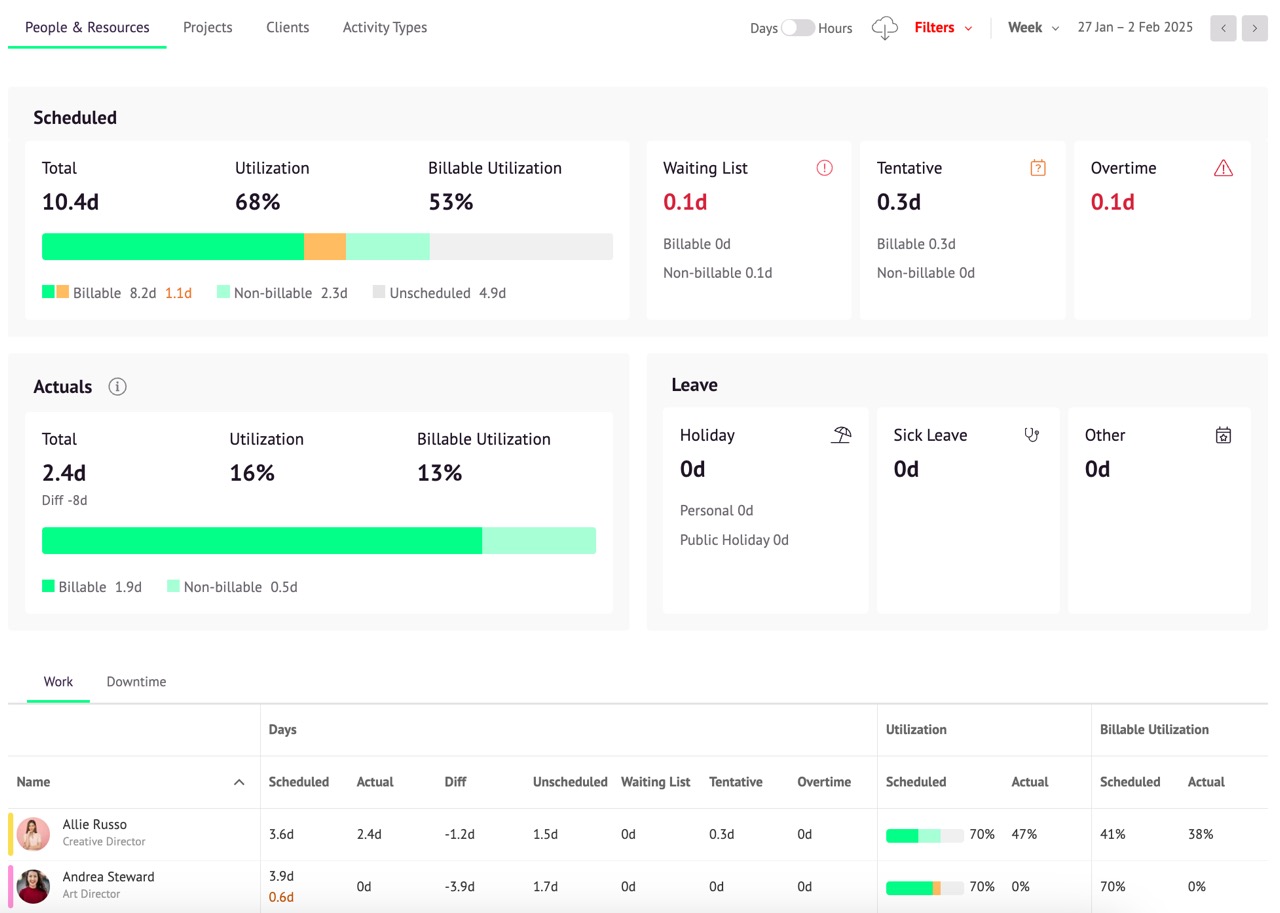
The Reports section lets you easily view utilization rates, understand how much capacity you have, and really drill down into the numbers.
If you have the Approval Workflow feature enabled, you’ll see orange bars in the reports as well as green ones, as shown above. For more information on how the approval workflow affects your reports, check out our article on Navigating the Reports with Approvals Enabled.
If Timesheets are enabled in your account, you'll notice additional data reflected in your reports. For example, you’ll see actual hours logged alongside the scheduled hours. For detailed guidance on how Timesheets impact your reports, check out our Navigating Reports with Timesheets Enabled article.
If you have set up rate cards on people and resources, you'll see additional data reflected in your project reports. You’ll see cumulative billable revenue across all projects within a defined time period. More details on how rates impact your reports, check out our Rates on People and Resources article.
Switching between Tabs
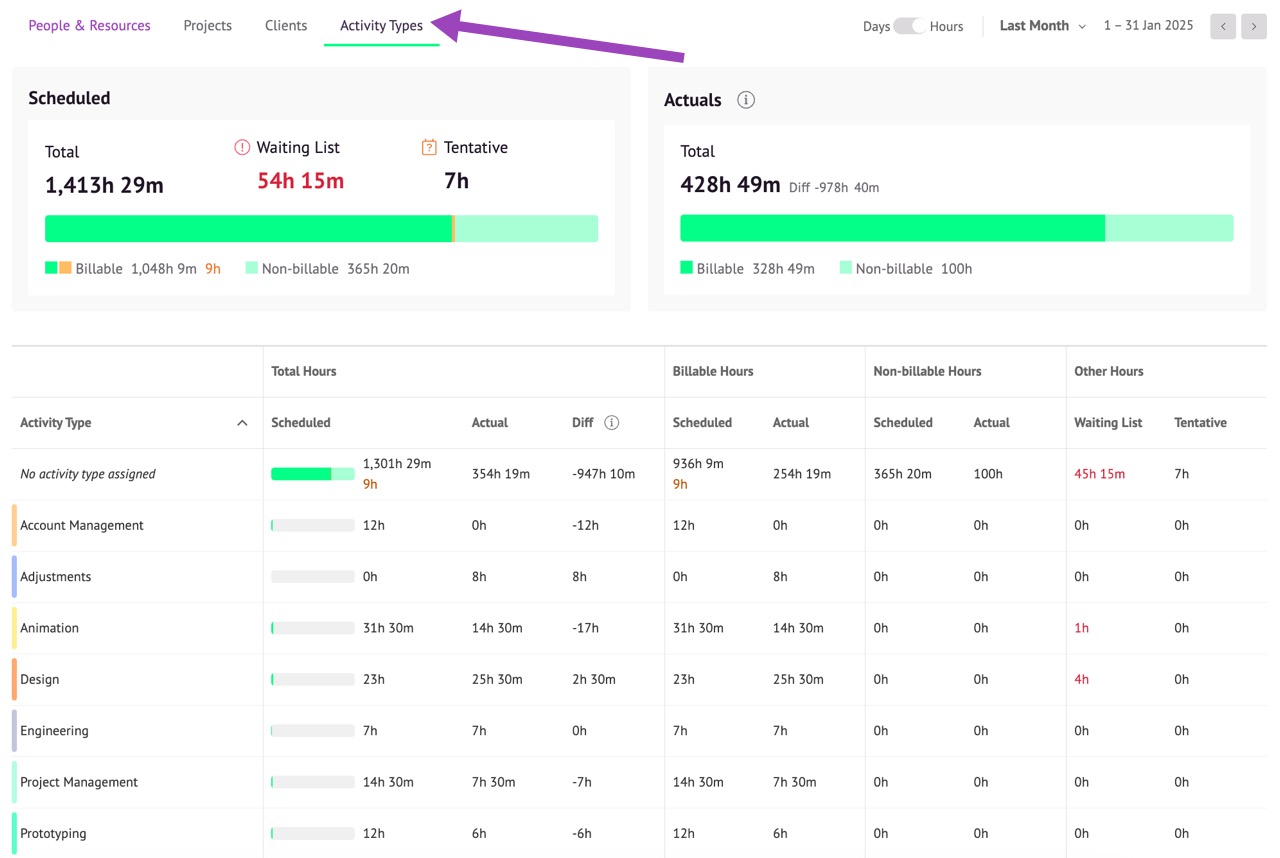
The People & Resources report is displayed by default. To switch between reports, choose People & Resources, Projects, Clients or Activity Type in the top left corner.
Changing the Time Period of your Report
Click on This Week to select a date range, and toggle between Days and Hours to choose how your data is displayed. By default, there are 8 hours in a day for your people resources and 24 hours in a day for your other resources. You can change the number of hours in a day over in your Settings.
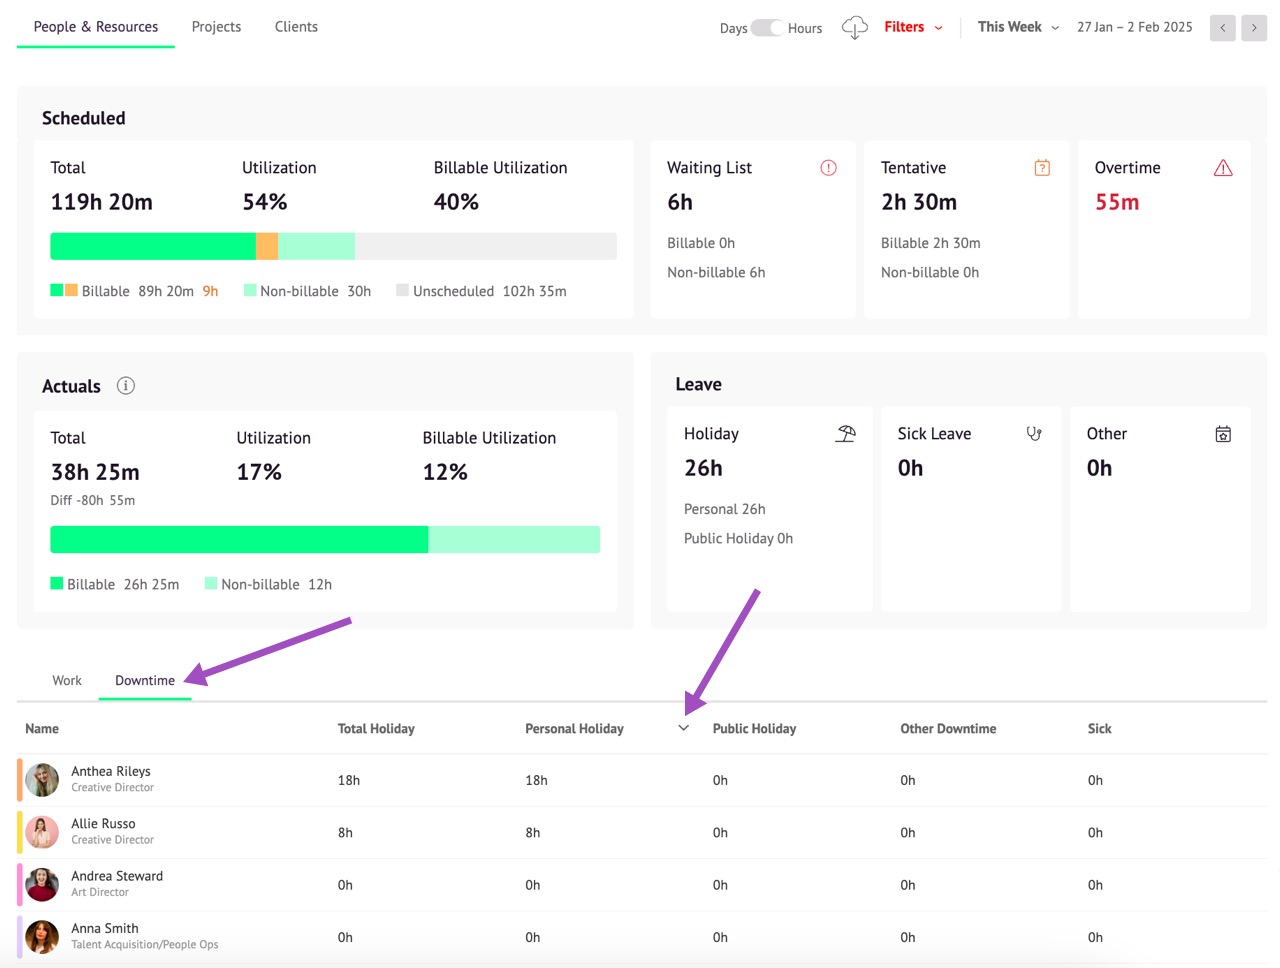
At the top of the report you’ll see some headline numbers relating to all the resources you’re reporting on, including the total utilization, overtime, waiting list and time off hours, as well as a breakdown of your billable and non-billable time. This information gives you an overall picture of what’s happening with all of your team and resources. You can also see these metrics on an individual basis next to each resource.
Sorting by Columns
You can sort column data alphabetically or by clicking on the column heading to arrange by increasing or decreasing values. When you sort by column, the rows of the table reorganize accordingly, which is very useful for capacity planning and seeing which resources are utilized the most and least.
Historical Data Appears in Reports
To ensure the accuracy of reports, your Projects, Clients, and deleted or archived Resources will still appear in all reports that cover any date range during which they were active.
Filtering People & Resources
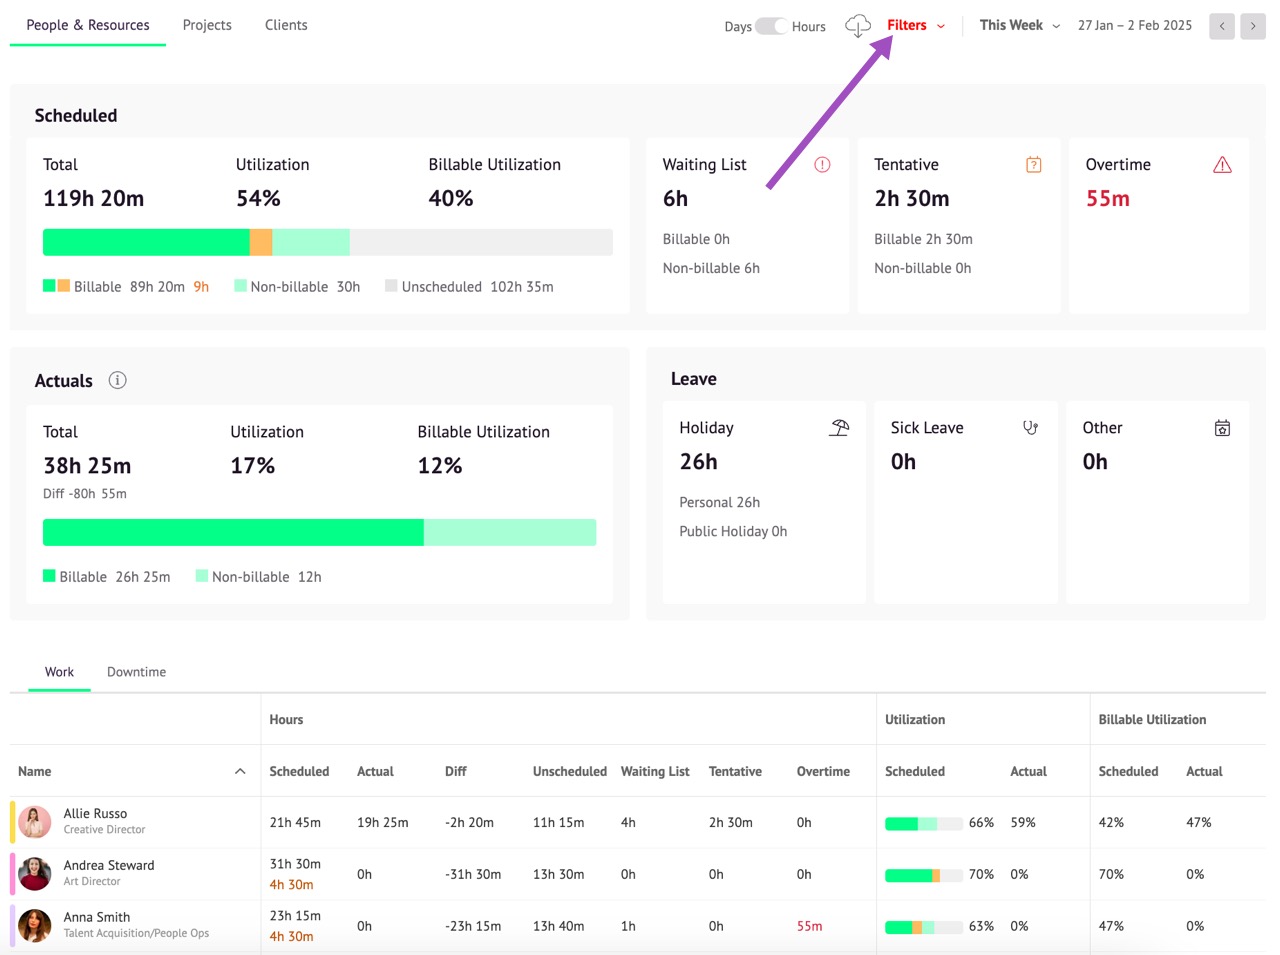
Need to run a utilization report on just one department? Or on one location? Reports offer powerful Filters that work in conjunction with custom fields to help you focus on specific groups of people & resources.
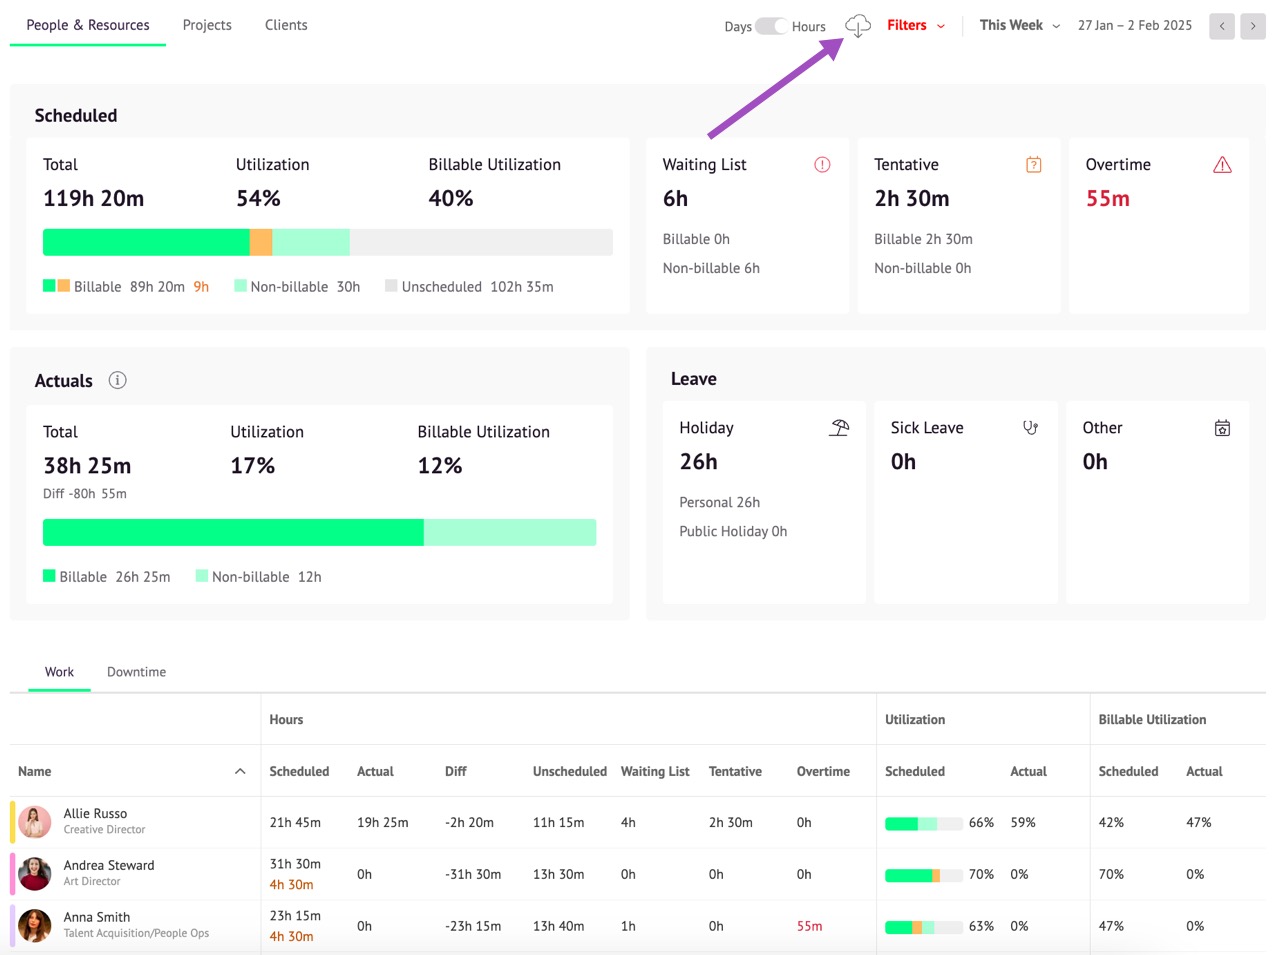
And if you prefer to crunch the data yourself using a spreadsheet, just click the download button to export your reports in CSV format.
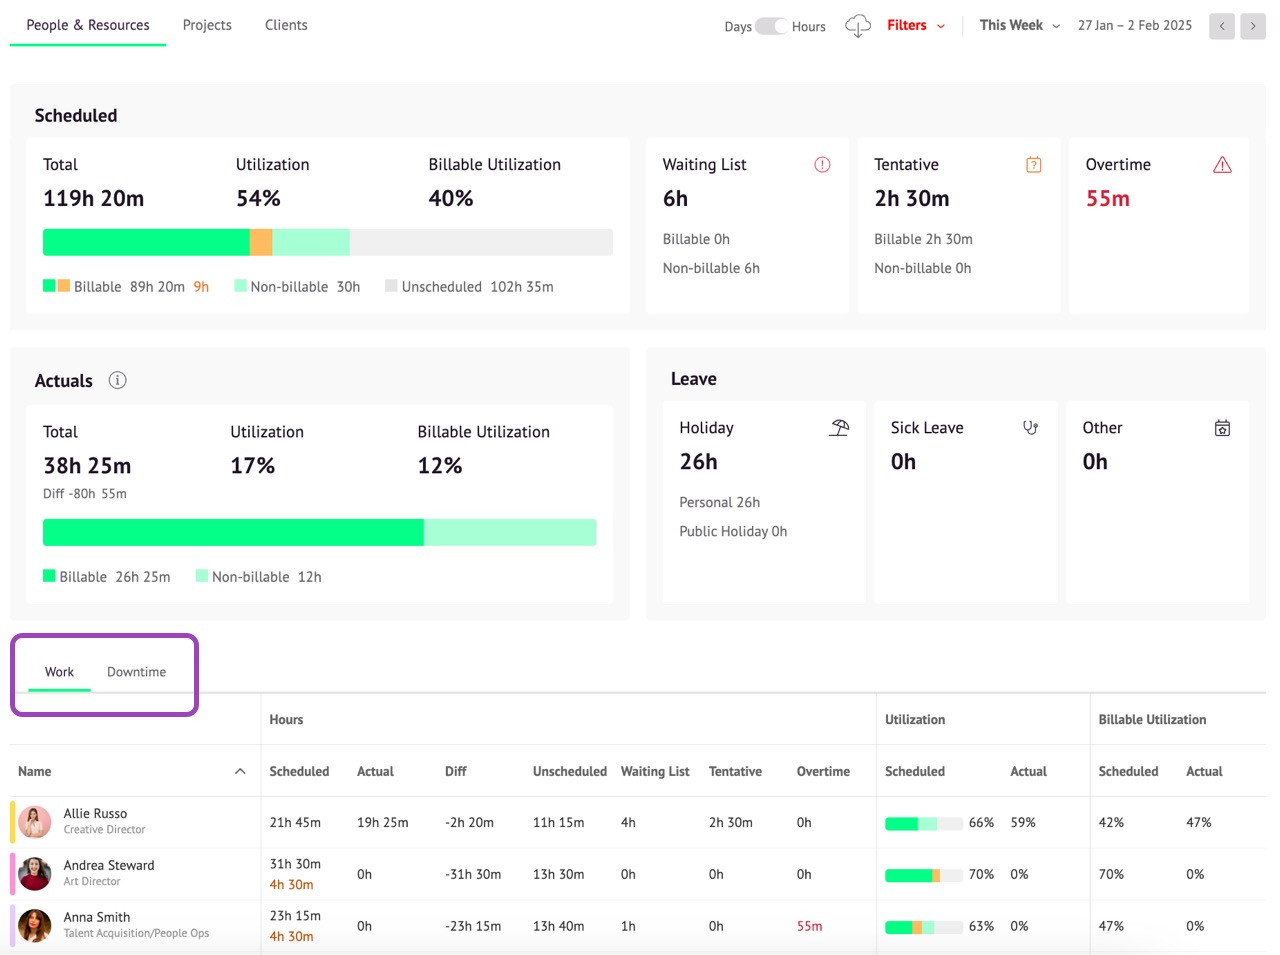
Switching Between Work and Downtime
Resource reports are split into two main categories -
Work
Downtime
On the Work tab you will see all of the resource’s booking data. The Downtime tab displays a breakdown of every resource’s scheduled time off or downtime. Here, you can track the amount of vacation, sick time or other time off that’s been booked by your team. Clicking on a column will sort resources by that parameter.
How We Calculate Utilization
Utilization rates are calculated as a proportion of time booked in relation to total time available. You will also see utilization rates based on billable vs. non-billable hours. It's important to note that total time available is reduced by time off. So, if someone has a personal vacation for 2 out of 5 days in a week, and is fully booked for the remaining 3 days, then they would be reported as 100% utilized for that week.
If a resource is normally available for 40 hours per week and you increase this availability by 4 hours, flagging these extra 4 hours as overtime, they will still appear as 100% utilized because all of their available time has been booked. You're not booking them for more hours than they have available—you're simply extending their availability, and the additional overtime hours will be reflected separately in the Overtime column in your reports.
We believe that a person cannot be more than 100% utilized because utilization is a measure of availability versus bookings. Once a person’s available time has been fully allocated, they are considered fully utilized, even if some of that time is overtime. Tracking overtime separately allows for better capacity planning without distorting utilization metrics.
Drilling Down Into Individual Reports
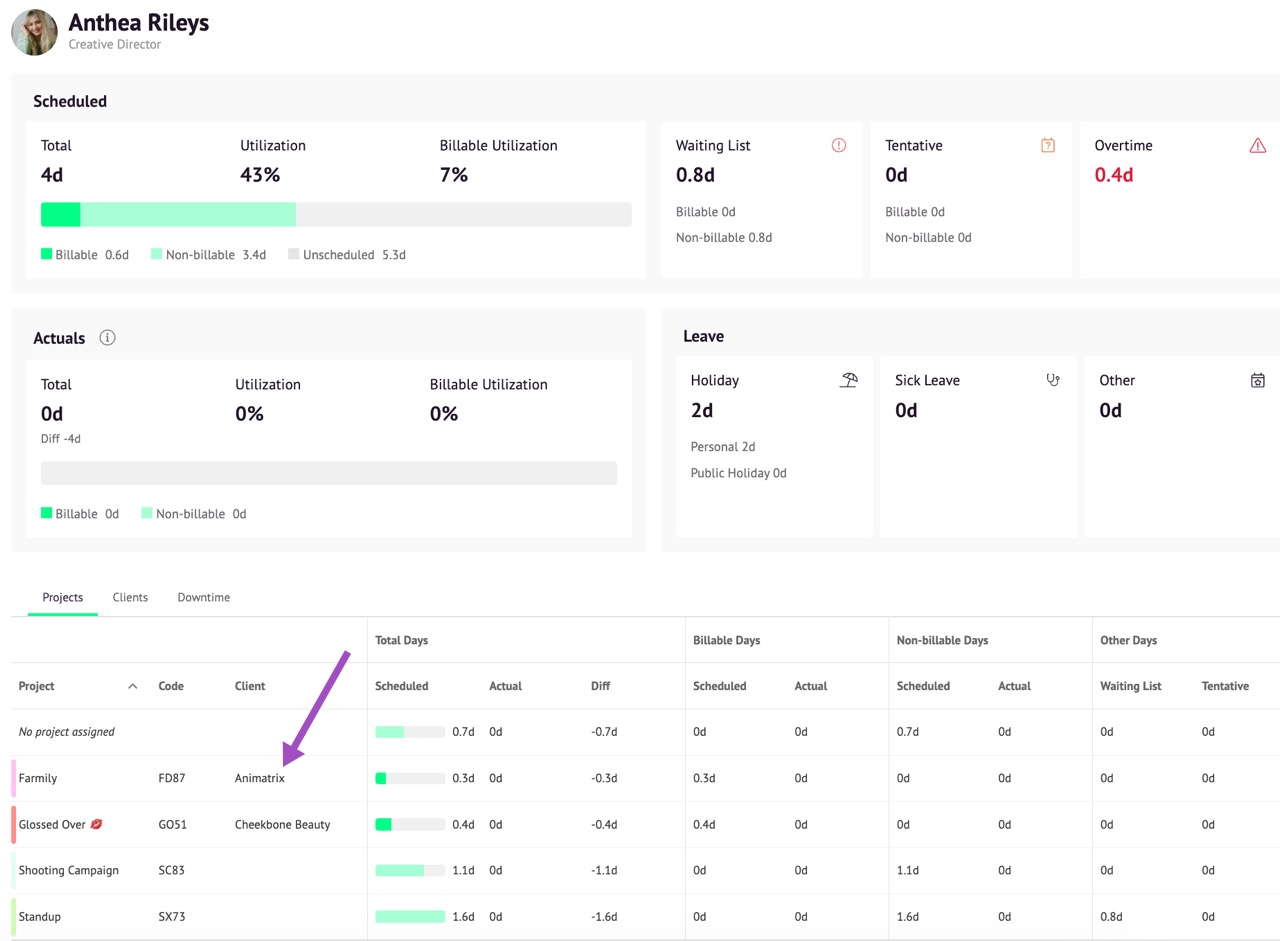
Drill down into resources by clicking on their rows to see a breakdown by Projects and Clients. This is a great way to see if you are over- or under-servicing clients and staying on top of project budgets.
From this drilled down view you can even jump straight to specific reports by clicking on that project or client.
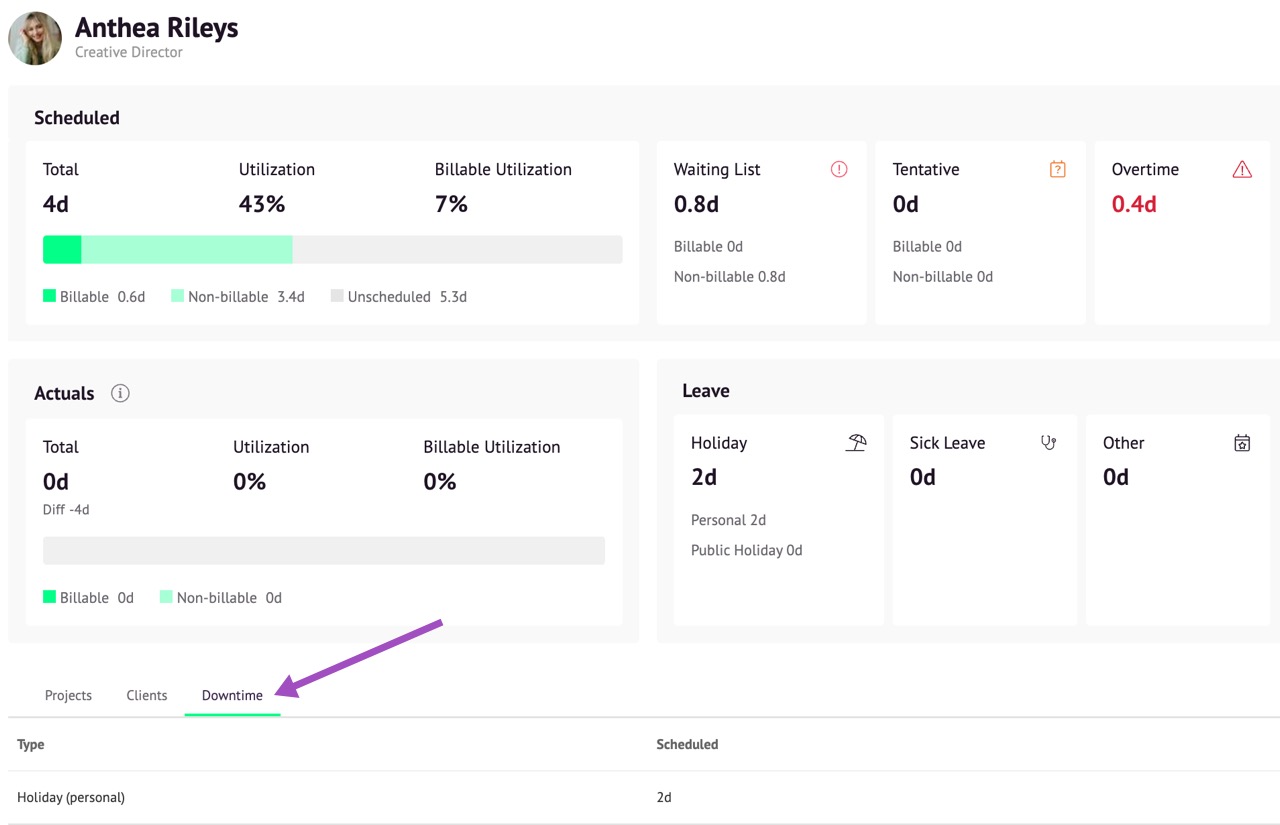
Click on the Downtime tab to see a breakdown of a resource’s downtime. To sort by the type or number of hours just click the Type or Scheduled column headings.
Project and Client Report
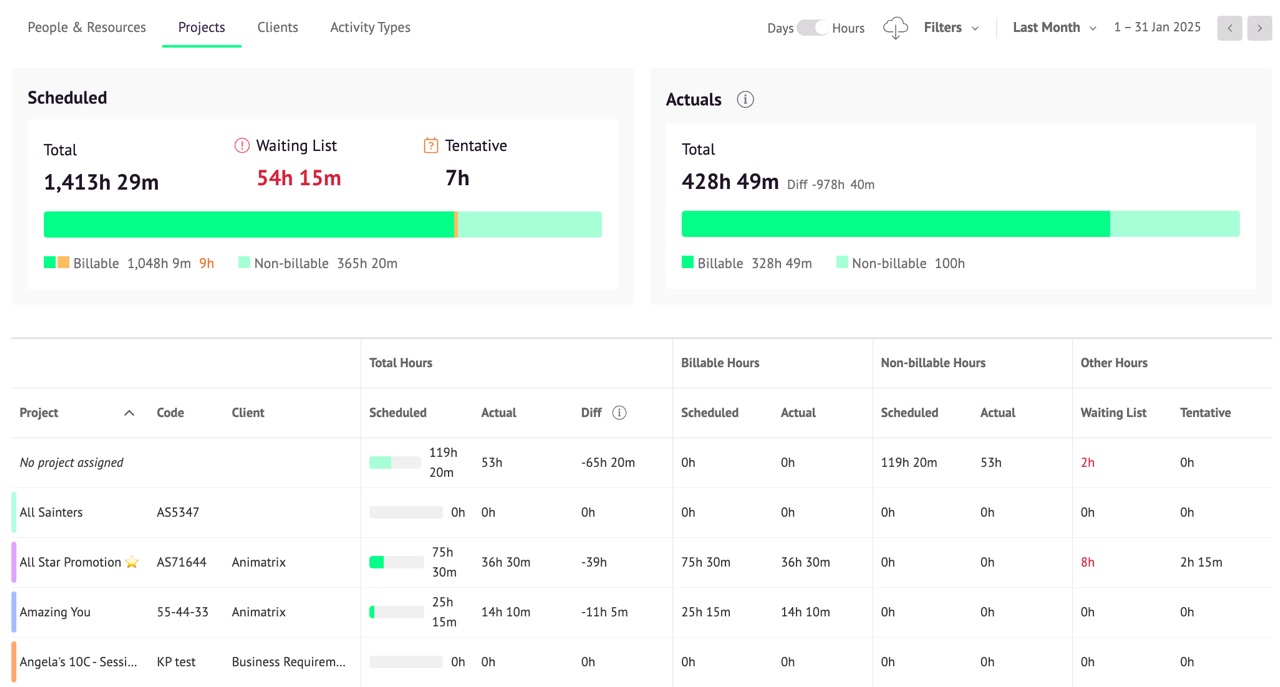
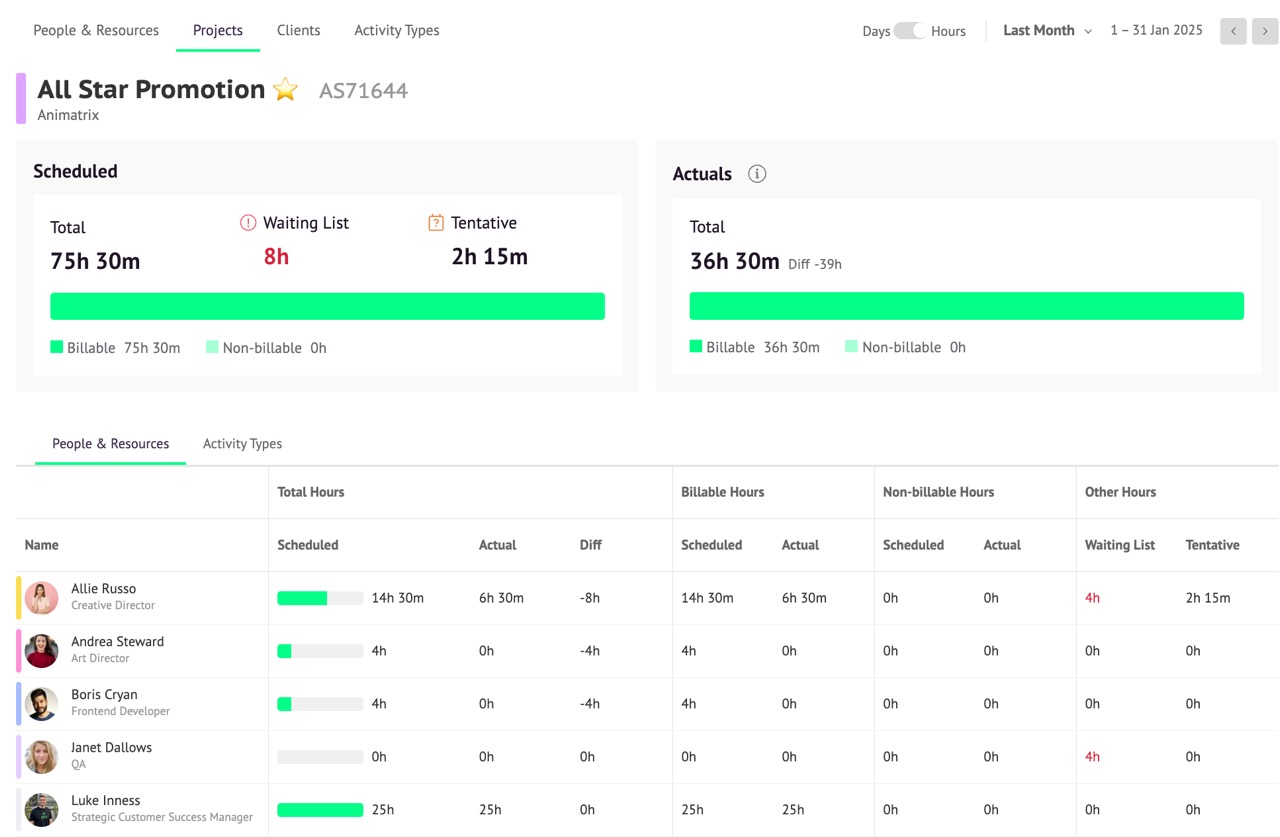
At the top of the Projects and Clients reports you’ll see the total Scheduled Time as well as the number of hours on the Waiting List and Tentative hours for all projects and clients within the specified date range. You’ll also see details of whether those hours are billable or non-billable. Breakdowns of this data are displayed for each project/client below.
Guru tip
You can use Filters to sort projects by specific clients.
Drill down into each project or client by clicking on it. You’ll see a list of people and resources booked for that project/client, as well as other data you’ll find useful, such as how many hours each resource has been booked for the project, and what proportion of the booked hours are billable or non-billable.
From this drilled down view you can also click on each person or resource to jump directly to their individual report.
Switch from People & Resources over to Activity Types to view a detailed breakdown of scheduled and actual time logged for each Activity Type on this particular project.
Activity Types Report
At the top of the Activity Types report, you'll find an overview of the total Scheduled Time, alongside the number of days allocated to the Waiting List and Tentative bookings within the selected date range. This section also breaks down the time into Billable and Non-billable categories, giving you a quick snapshot of how your team’s time is allocated.
Below this summary, you'll see a detailed breakdown of scheduled and actual time logged for each Activity Type or where there is no activity type assigned. For every activity, the report shows:
Total Days scheduled and the actual time logged by your team, along with the variance (Diff) between the two.
A split between Billable Days and Non-billable Days, both for scheduled and actual time.
Time allocated to Waiting List and Tentative bookings, highlighted separately to help identify unconfirmed work.
This layout helps you analyze how time is being spent across different activities within a project.
Please note: When viewing your report data in Days, numbers will be rounded which can lead to discrepancies between reports. If you need more consistent results, display your reports in Hours instead.

