
Navigate The Reports
Please note: Reports are included with the Blackbelt and Master plans. If you’re a Grasshopper subscriber, upgrade now to gain instant access to these powerful reports.
The Reports section lets you easily view utilization rates, understand how much capacity you have, shows your planned vs. actual hours and really drill down into the numbers.
Adjusting the Date Range
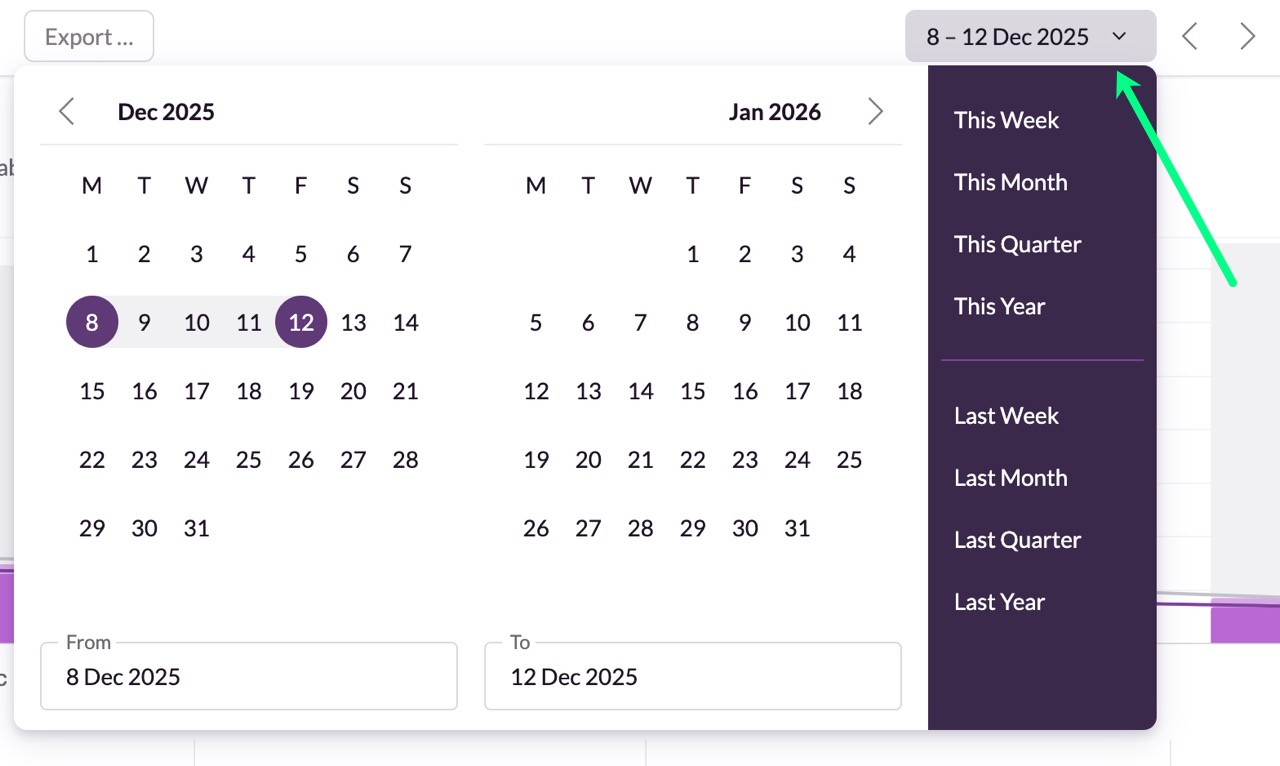
Use the date picker in the top-right to select a timeframe:
Choose from presets like This Week, Last Month, etc.
Or define a custom range.
Managing What is Included as Scheduled Time
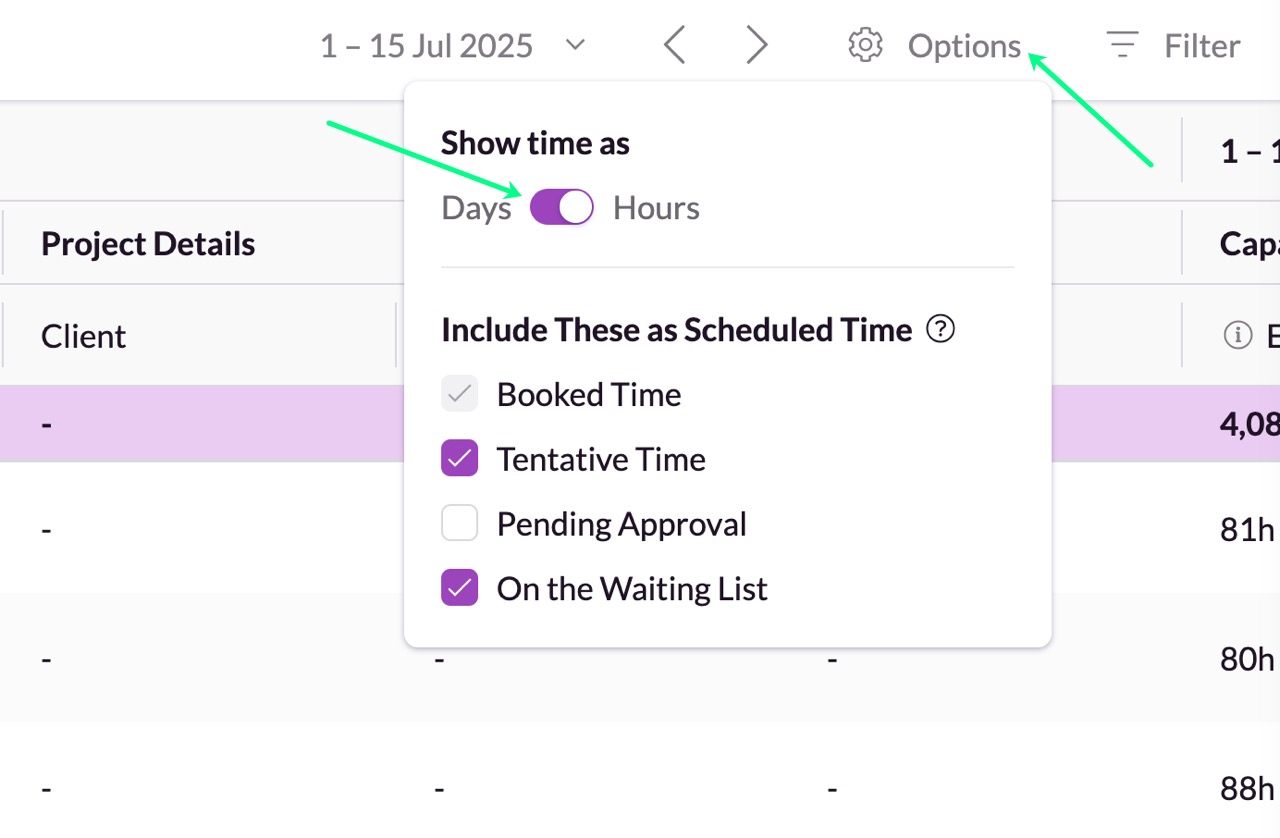
Click on Options to show your time in Days or Hours. You have flexible control over what booking states count as "Scheduled Time."
By default, Scheduled Time = Booked Time, but you can include:
Tentative Time.
Pending Approval Time if you’re using the Approval Workflow.
Time on the Waiting List.
This helps with scenario planning (e.g., hiring needs if all tentative projects are confirmed). Metrics like Scheduled Utilization and Remaining Capacity are based on this custom definition of Scheduled Time.
How Placeholder Time Affects Utilization
Placeholder resources can have time booked against them, but they always have 0h availability. Any time booked against them can artificially inflate utilization metrics, since utilization is calculated as time booked divided by availability. Including placeholder time can inflate utilization rates above 100%.
If this happens:
An exclamation icon will appear on any cell with an inflated metric
You can filter out placeholders to return to accurate numbers
Using Placeholders to Report on Capacity vs. Demand
Placeholders are a great way to help you get visibility of capacity vs demand. For example, if I want to see how the design department is looking over the next few weeks, I can filter to “Designers” and “Design Placeholders” and save the view as “Design Capacity”. I can then go to the Utilization & Capacity report in Reports and apply that saved view using the filters.
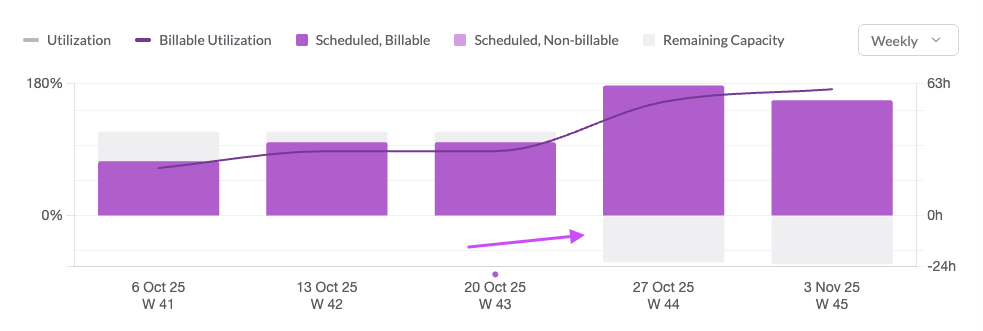
Here I can see that I’m going to run into trouble in the next two weeks if I don’t reallocate some work or get some freelancers to help.
Other ways to plan ahead: Tentative & Waiting List bookings
In addition to placeholders, you can also use Tentative bookings and Waiting List bookings to model different demand scenarios.
Tentative bookings are useful when work is not yet confirmed. They help you plan ahead without blocking availability, so you can see potential workload without committing resources.
Waiting List bookings are used when work definitely needs to happen, but there isn’t enough availability yet. These bookings are flagged so you can resolve them as soon as capacity frees up.
These methods are especially helpful when forecasting capacity, as you can include or exclude them in reports to understand best- and worst-case scenarios.
For a full walkthrough of how placeholders, tentative bookings, and waiting list bookings work together, watch this video:
Apply Filters to Your Reports
Filters help you narrow your view to specific people, teams, departments, or custom fields. You can also filter by people booked on certain projects or clients.
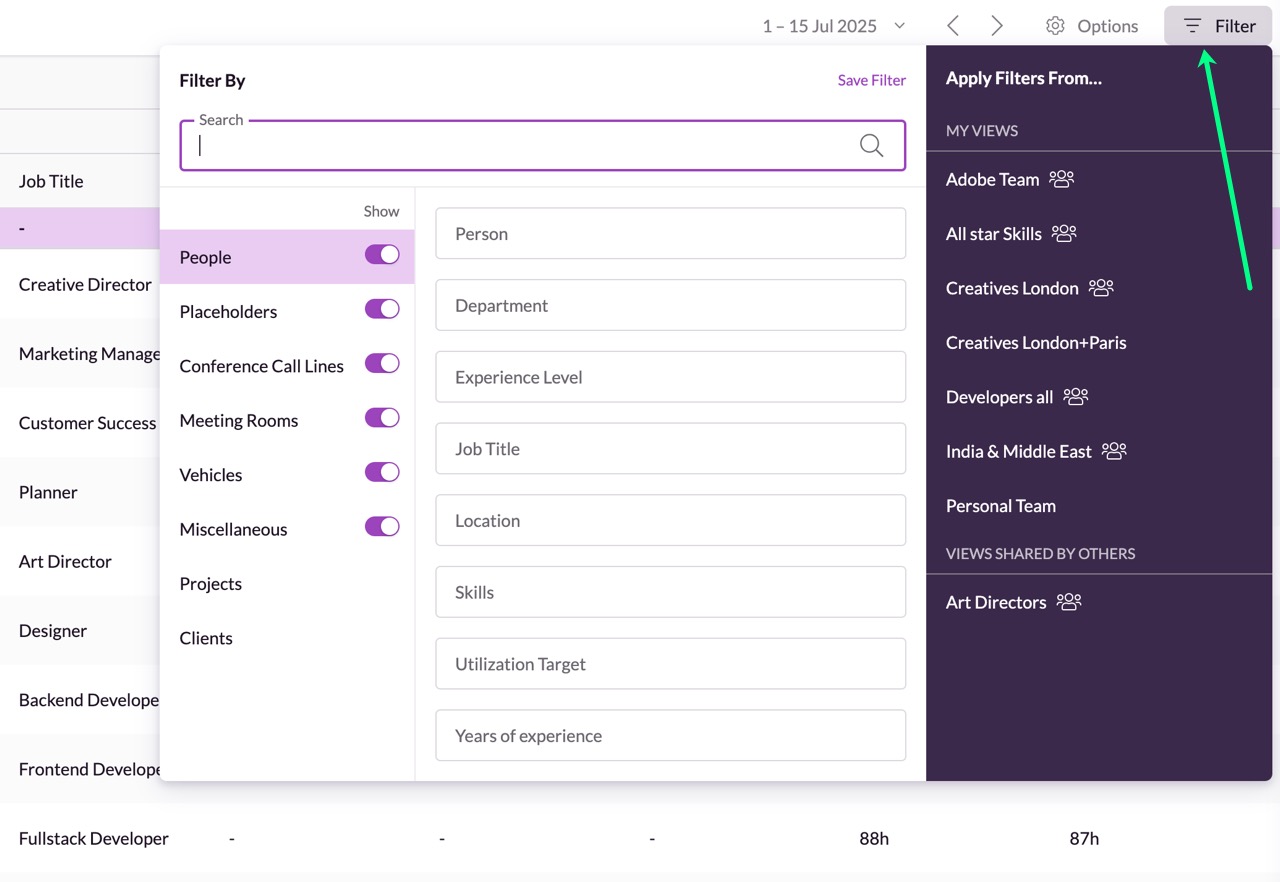
Filters work the same as in the Schedule view.
Saved views are shared across Reports and the Schedule. Only Saved Views that include Filters will appear in Reports.
You can update filters in either place and see changes reflected across both.
Please bear in mind that archived resources will be included in the filtering if they have been active during the selected time period. Deleted resources won't be shown.
Using Standard Reports
All standard reports follow the same format:
A chart or visual.
Key stats.
A customizable table with preset columns.
Your column setup is auto-saved. Standard reports include a Reset button to return to defaults. If no time is logged for a scheduled day, the system assumes scheduled hours were worked. If any time is logged, no assumptions are made.
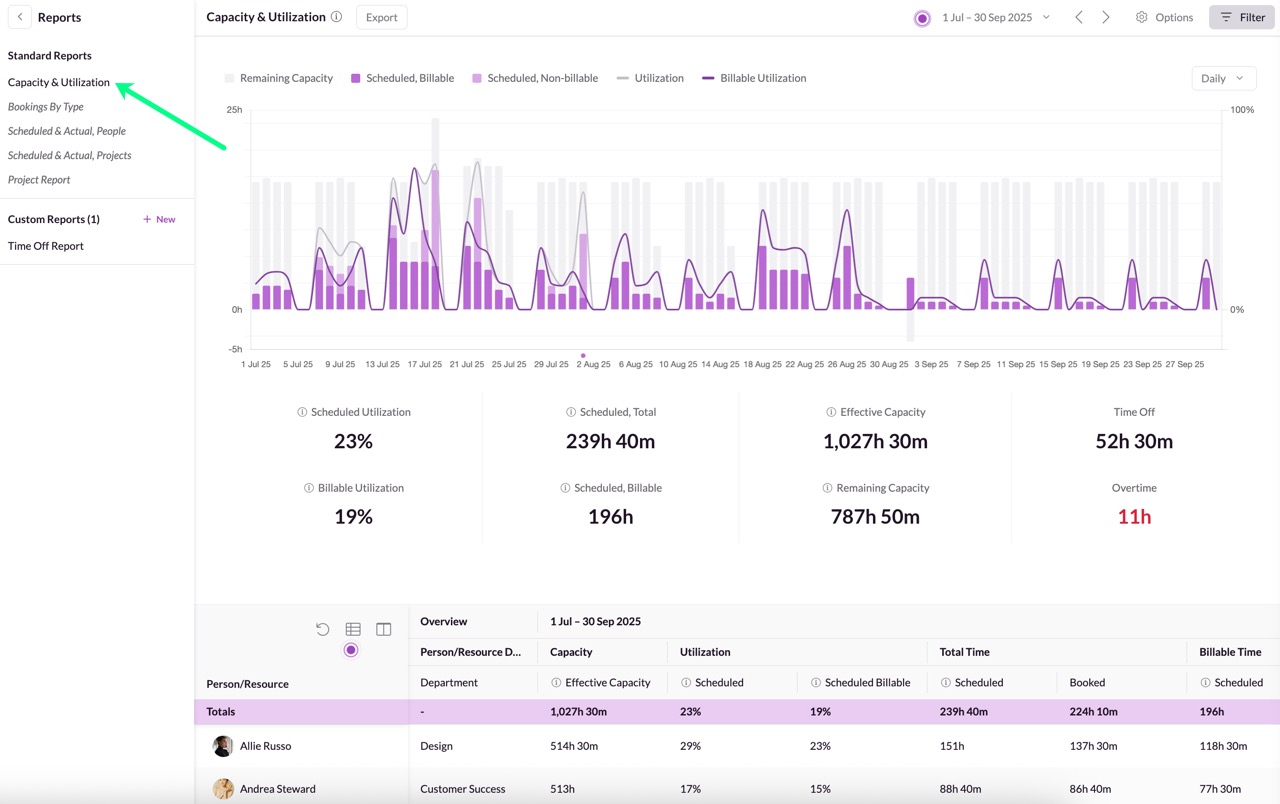
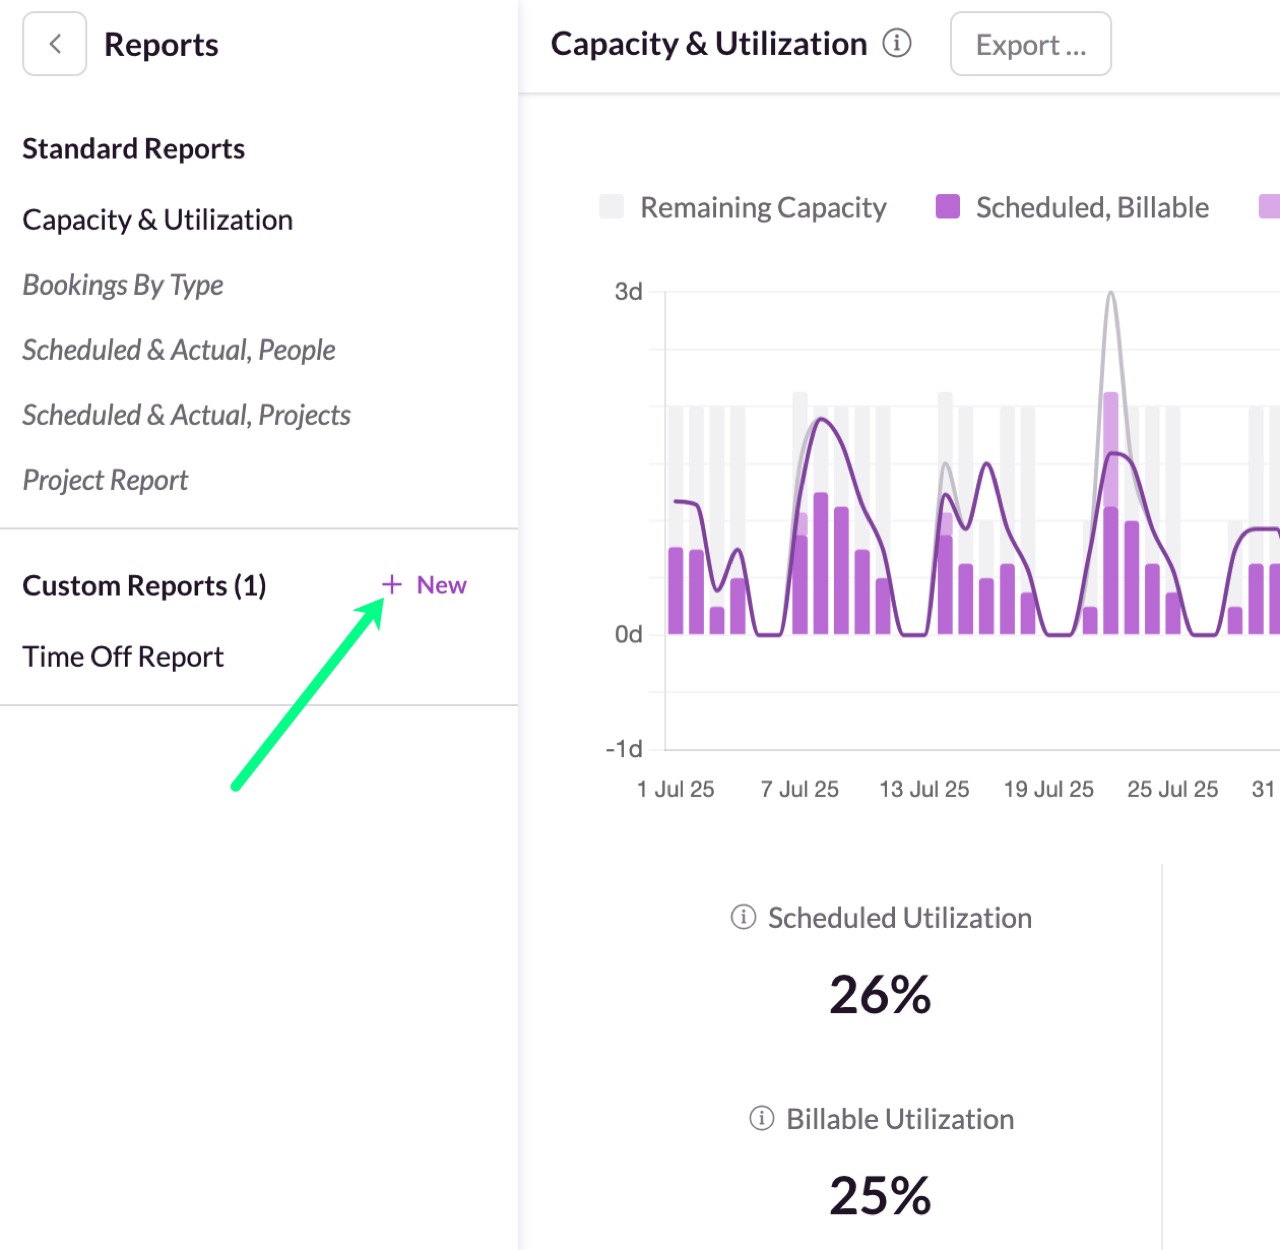
Capacity & Utilization
This report supports both backward-looking analysis (lost time, non-billable tracking) and forward-looking planning (future staffing).
Unlike the heatmaps view in the Schedule, utilization reports can exceed 100%, a result of placeholder time or included tentative work. Filtering them out shows true person capacity.
Click the kebab menu (•••) next to Default Reports / Capacity & Utilization
Select the Capacity & Utilization report
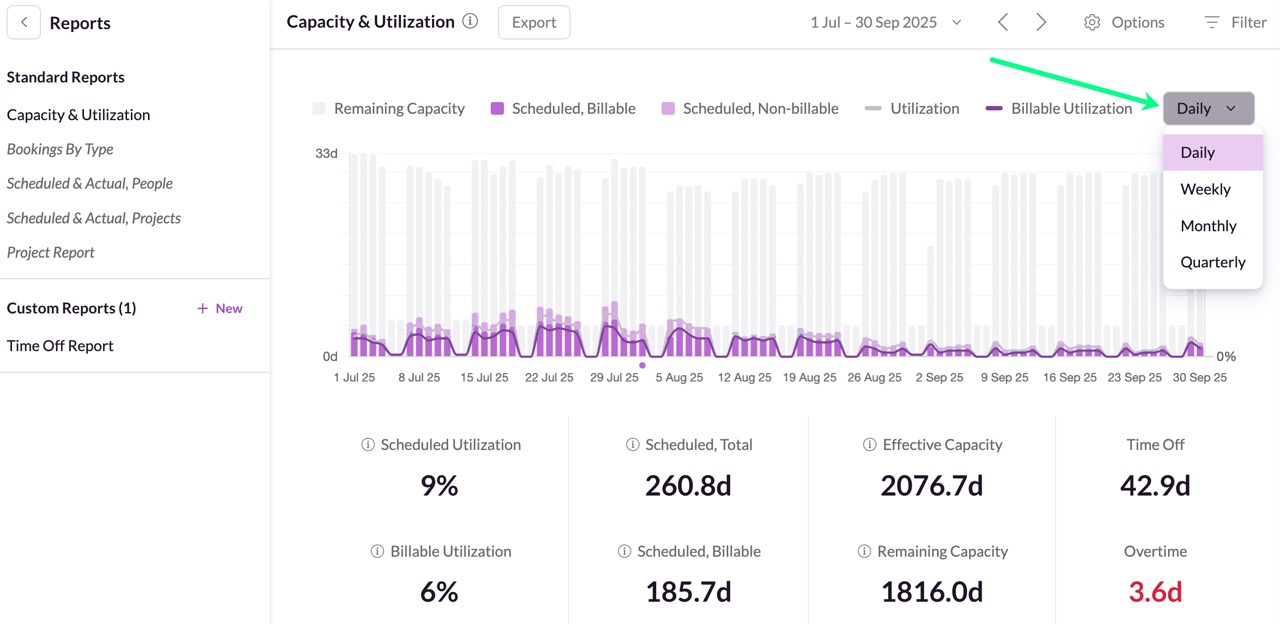
Hover over each day for a daily breakdown of utilization and capacity. Include or exclude e.g. Remaining Capacity or other options from the list above.
The height of each bar shows the team’s effective capacity for that period — for example, if there’s a lot of holiday or sickness, the available capacity will be lower. The purple bars indicate how much of that capacity has been used, split between billable and non-billable time.
Bookings By Type
A future-facing view for resource and revenue planning. Highlights tentative and pending approval work that needs confirmation.
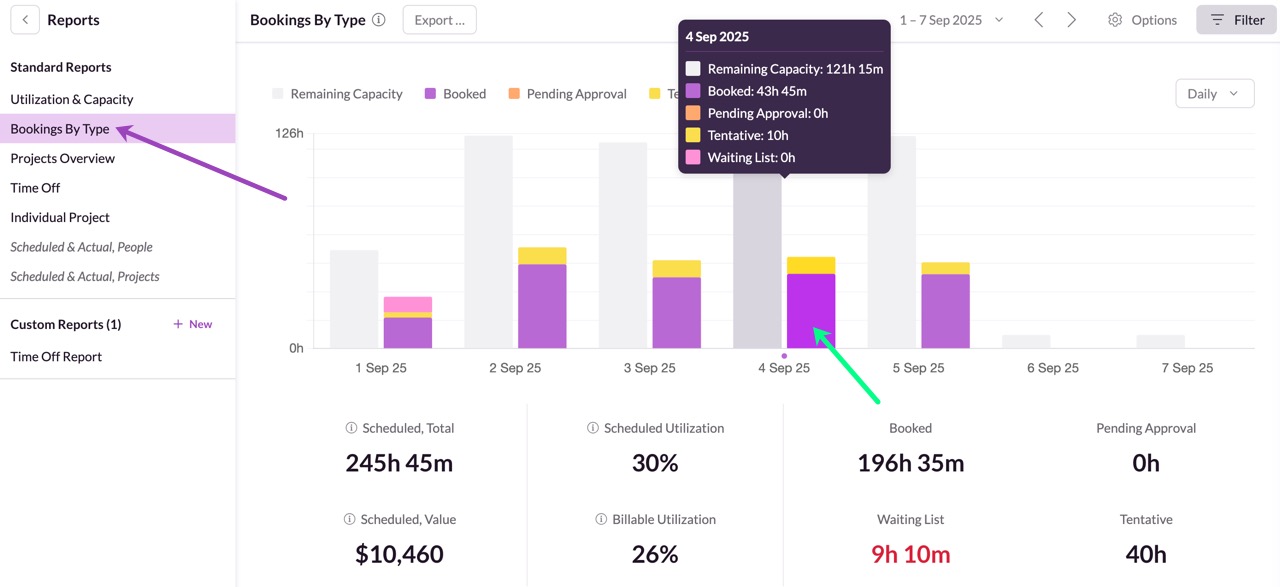
This overview helps you see how your bookings are distributed, giving you a clear picture of how your schedule is shaping up. By reviewing the breakdown of your booking types, you can plan ahead more effectively and quickly identify areas that may need your attention.
Time Off
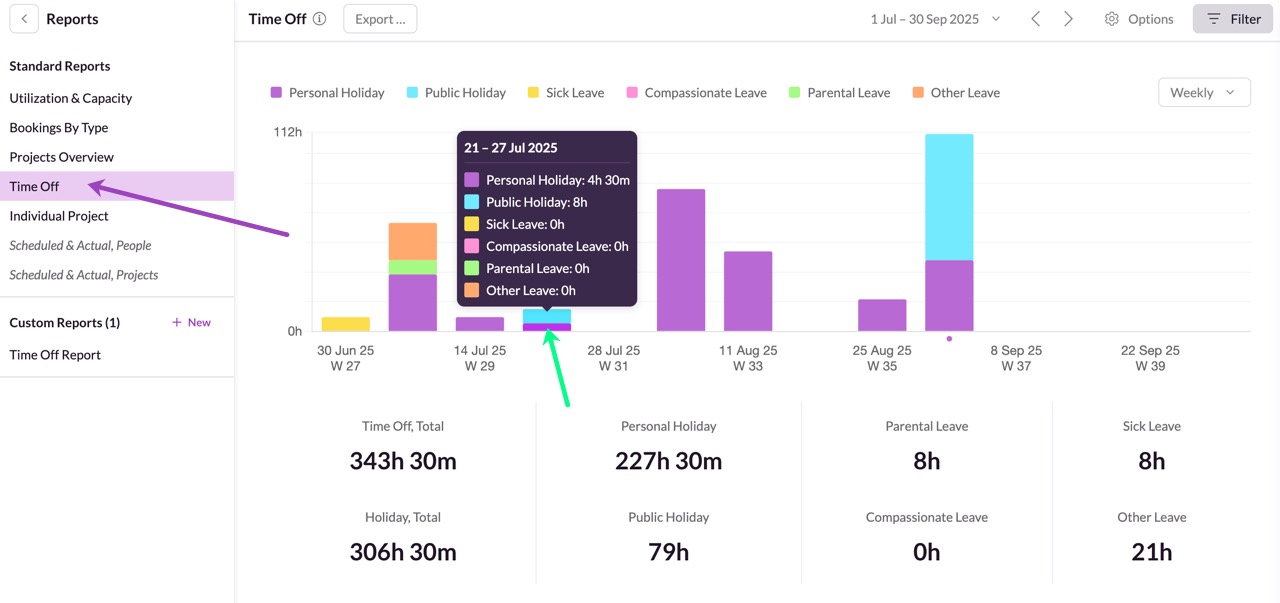
The Time Off view gives you a centralized overview of leave across your team. You can see breakdowns by time off type, making it easier to support planning, maintain wellbeing, and ensure compliance with company policies.
Project Overview
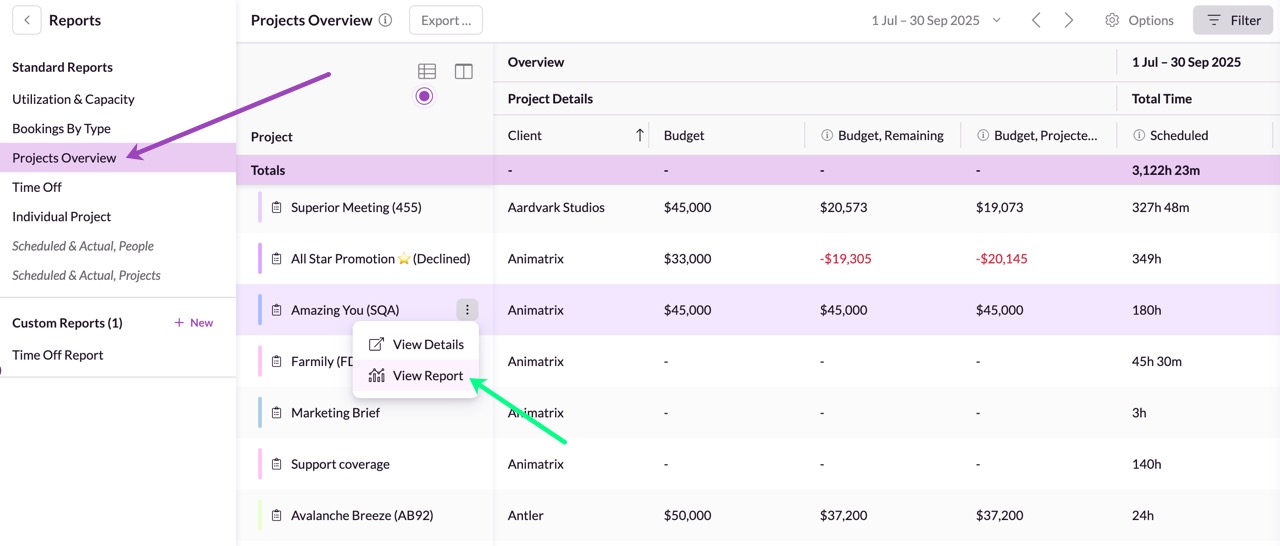
The Projects Overview provides a report on all projects, grouped by client. This view makes it easy to track client-specific work, monitor progress, and review overall project activity in one place.
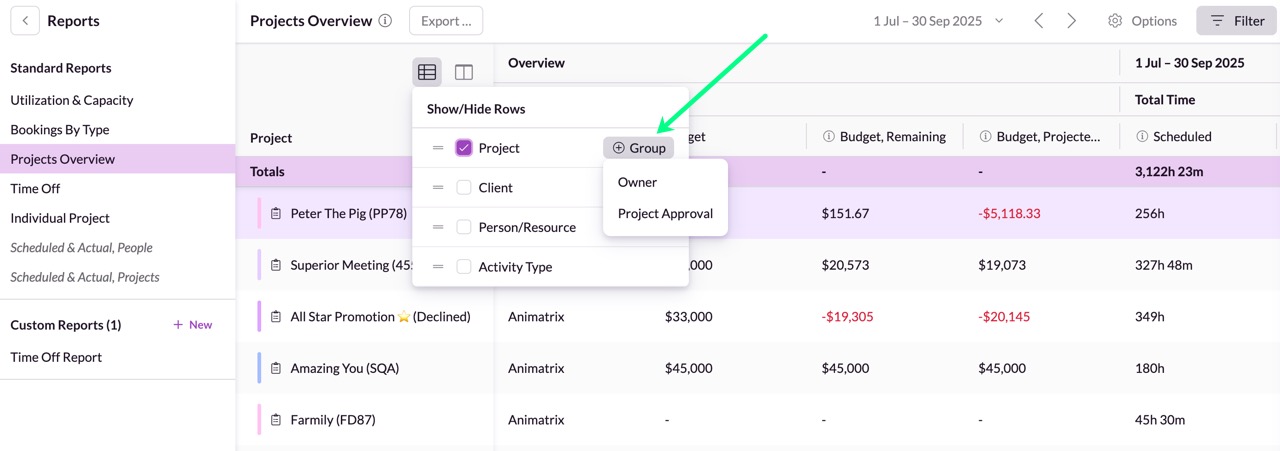
You can group your projects by any single-select custom field you’ve added to the project form. For example we’ve set up the fields Owner or Project Approval to organize the view.
View by different periods: Daily, Weekly, Monthly, or Quarterly
In the top-right corner of the chart, you’ll see a dropdown menu—this is where you can switch between:
Daily (great for short-term planning)
Weekly (ideal for sprint or campaign overviews)
Monthly (perfect for capacity forecasting)
Quarterly (for long-term planning or stakeholder updates)
Combine Them With Filters
Use the Filter options to tailor the chart to your needs. You can filter by:
A specific person or group of people, placeholders or resources
One or more projects
Use Custom fields like people in a specific location, with a certain skill set, or role
Use your existing saved views
Using Custom Reports
Click +New to create a custom report. Make sure to double-check your filters and selected time period. From there, you can choose your row and column options to tailor the report to your needs.
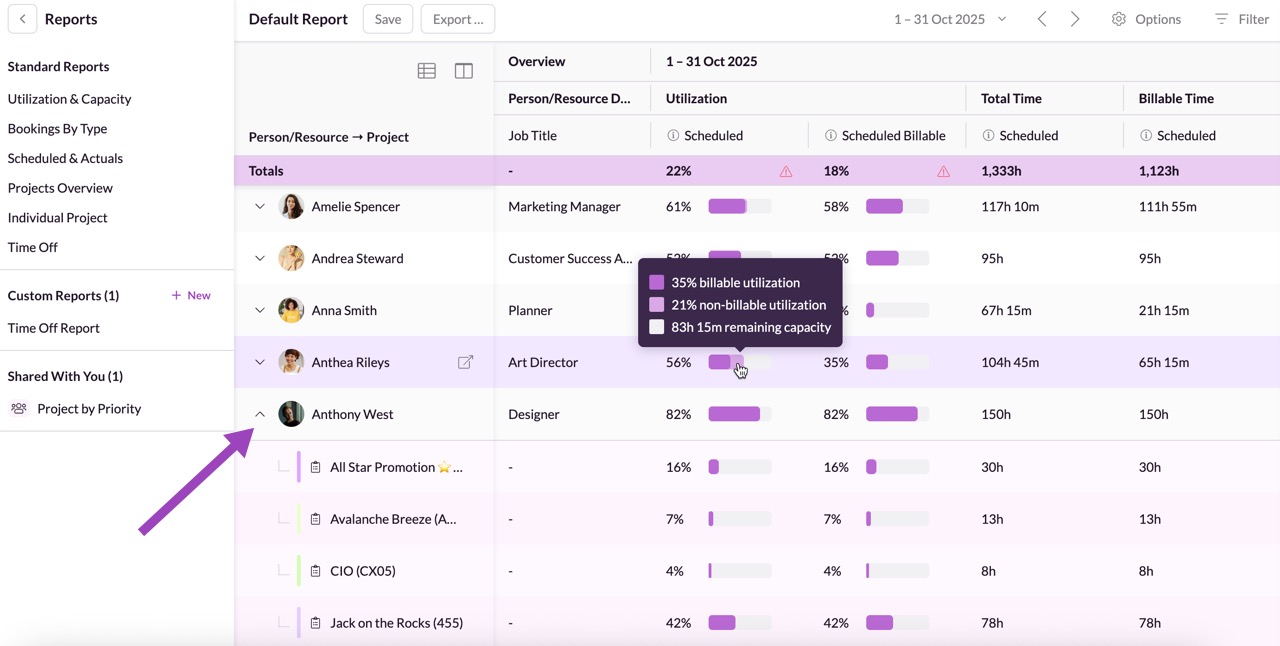
Understanding Rows and Columns
You can click on any row to drill deeper into the data.
Rows control the primary level of data shown in your report—such as People, Projects, Clients or Activity Types. At each subsequent level, you can sort and filter data just as you would in the main view.

You can:
Choose which entity appears as a row (e.g., Person or Resource).
Add drilldowns (e.g., Person → Client → Project → Activity Type).
Rearrange row hierarchy by dragging them up or down in the Rows menu.
use grouping by single-select custom fields on your people/resource profiles.

You can group your resources by any single-select custom field you’ve added to resources. For example we’ve set up the fields Job Title or Experience Level to organize the view.
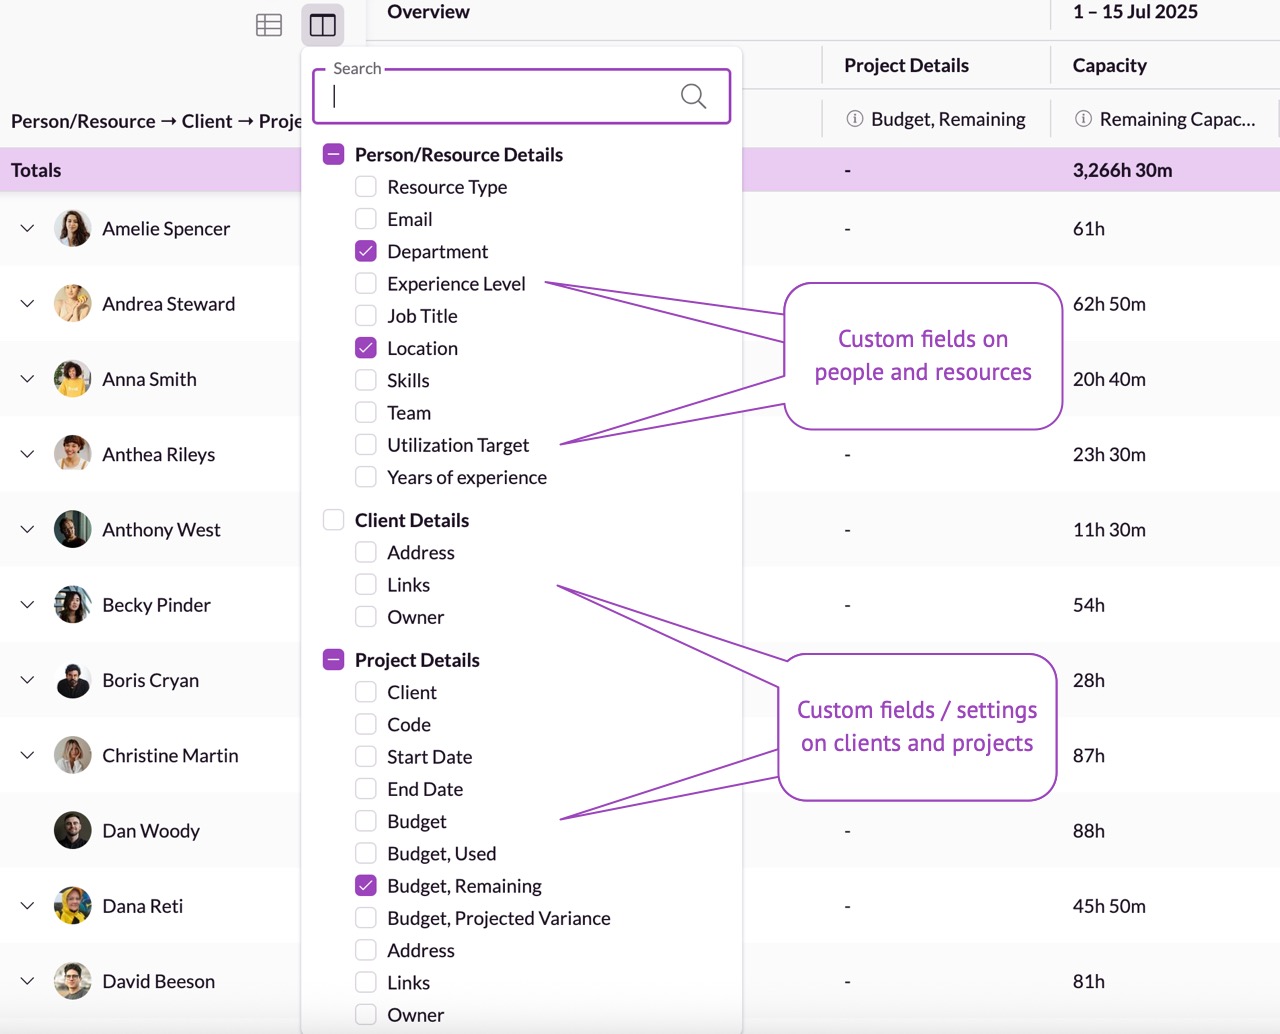
Columns define what information appears for each row. You can:
Add or remove columns such as Booked Time, Effective Capacity, Utilization, or Billable Value and much more.
Use search to quickly find specific fields.
Sort by any column to rank or compare.
Once you've configured your report exactly how you want it—rows, columns, sorting, and time settings—you can save it as a custom report to quickly return to it later.
What’s saved in a custom report:
Row setup (e.g., People, Projects, Clients)
Column selection (e.g., Booked Time, Utilization, Revenue)
Sort order (e.g., by Utilization % or Capacity)
Time type settings (e.g., whether Scheduled Time includes tentative hours)
Date range (relative, like “This Week”, or a specific period)
Note: Filters are not saved here. Filters (to show specific people or non-human resources, projects or clients) are managed separately in the Filter Panel.
This means you can apply your favorite view setup and layer on different filters as needed, without affecting the underlying custom report structure.
Use these two reports side by side to compare a team's scheduled utilization versus their actual logged hours.
Saving your Report:
Configure your report as explained above (rows, columns, sort, time settings)
Click Save Custom Report
Give your view a descriptive name
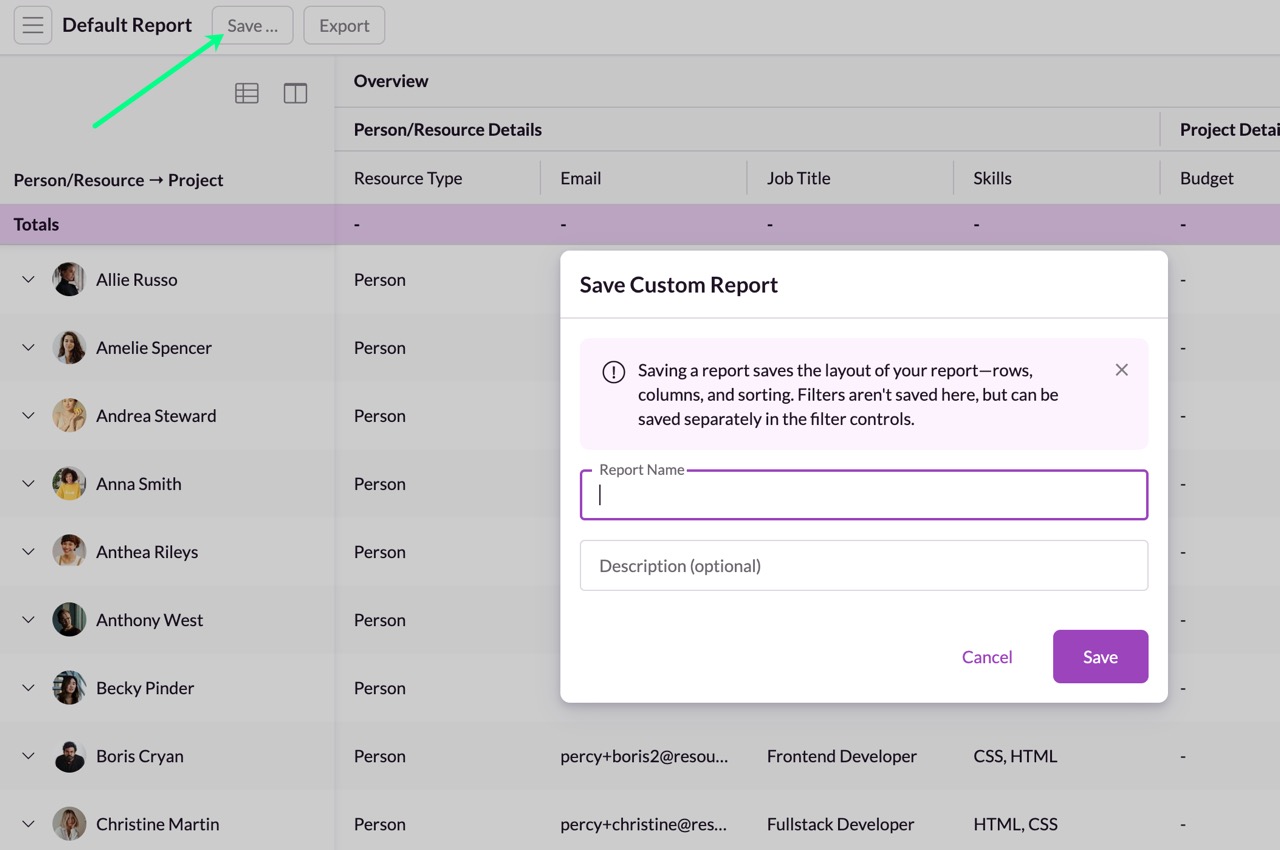
Your saved reports will then appear in your navigation sidebar next to Default Report.
Exporting Report Data
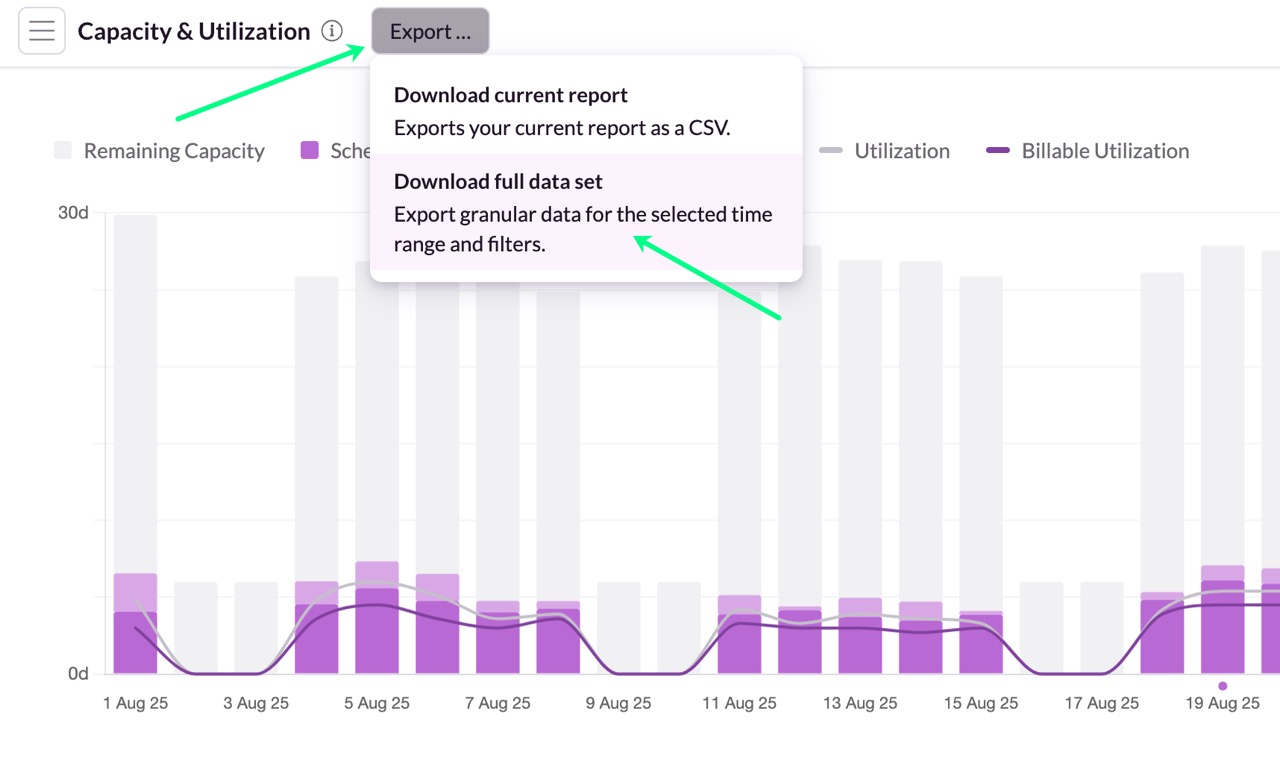
Use the Export button to export your report as a CSV file.
The export will include only the rows and columns currently shown
Note: Capacity columns will only export when Person/Resource is selected.