Manage your Projects with Gantt Charts
Please note: Gantt charts are included with the Blackbelt and Master plans. If you’re a Grasshopper subscriber, upgrade now to gain instant access.
Gantt charts in Resource Guru help you connect project planning with scheduling, so you can build realistic timelines and keep work on track. They allow you to structure your projects and map work over time using:
Phases – Break your project into clear stages
Tasks – Define the work required within each phase
Finish-to-start Dependencies – Link tasks together with automatic adjustments when changes are made
Who Can View, Create and Edit Gantt Charts
Access to Gantt charts is based on your project permissions.
If you have edit all permissions for projects, you’ll be able to create and update every project’s Gantt chart, including phases, tasks, and dependencies.
If you only have view access, you can still open the Gantt chart section and see the project’s full plan, but you won’t be able to create or edit them.
If you have edit items they create permissions, you’ll only be able to edit Gantt charts for those projects.
Accessing Gantt Charts
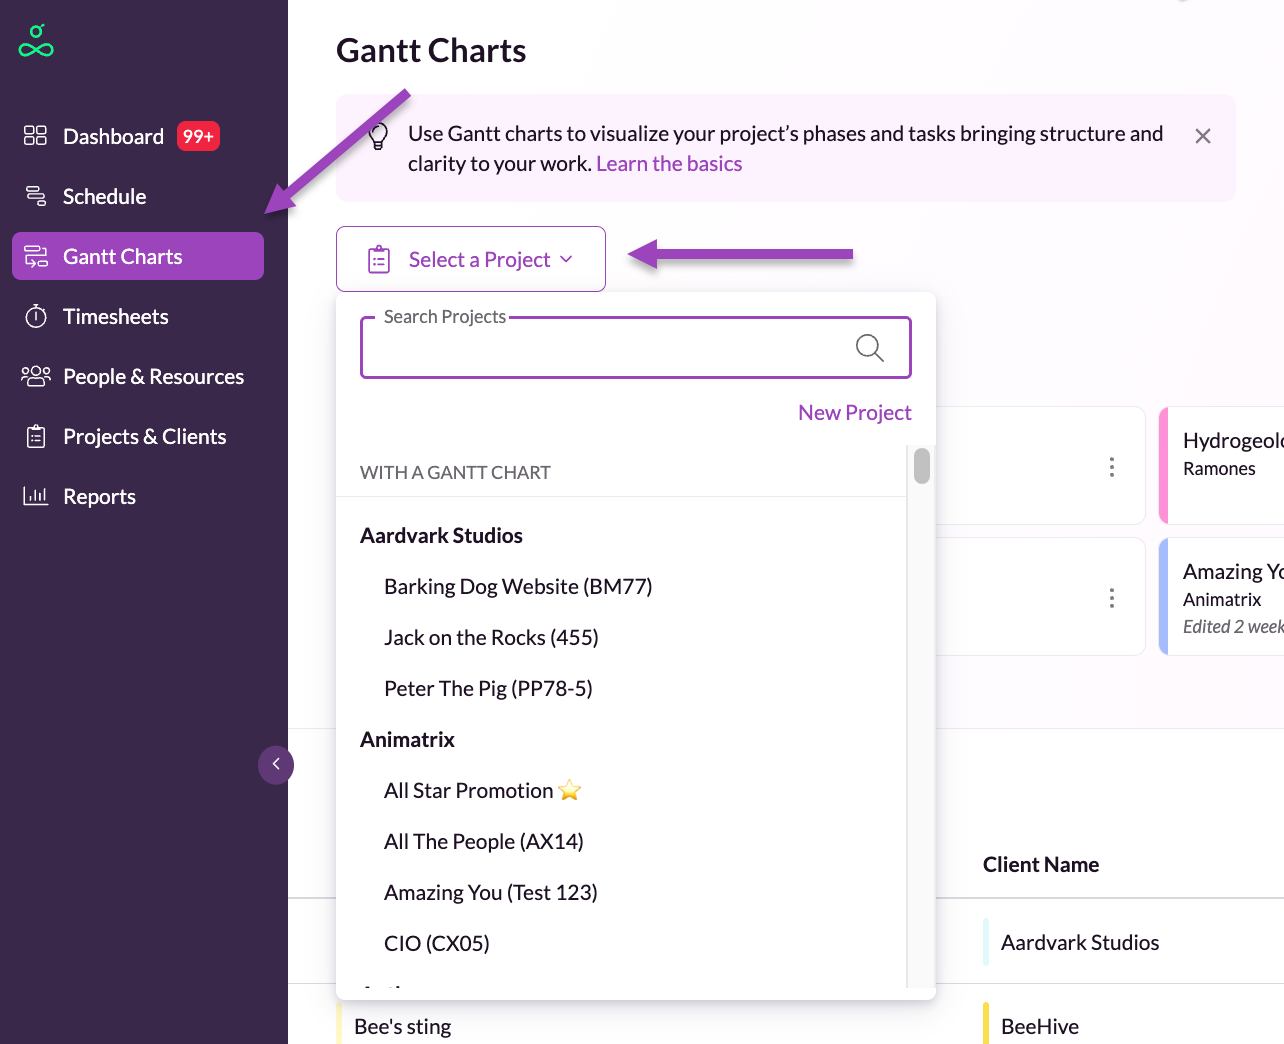
To get started, open Gantt Charts from the sidebar. Click Select a Project to search for an existing project, or create a new one.
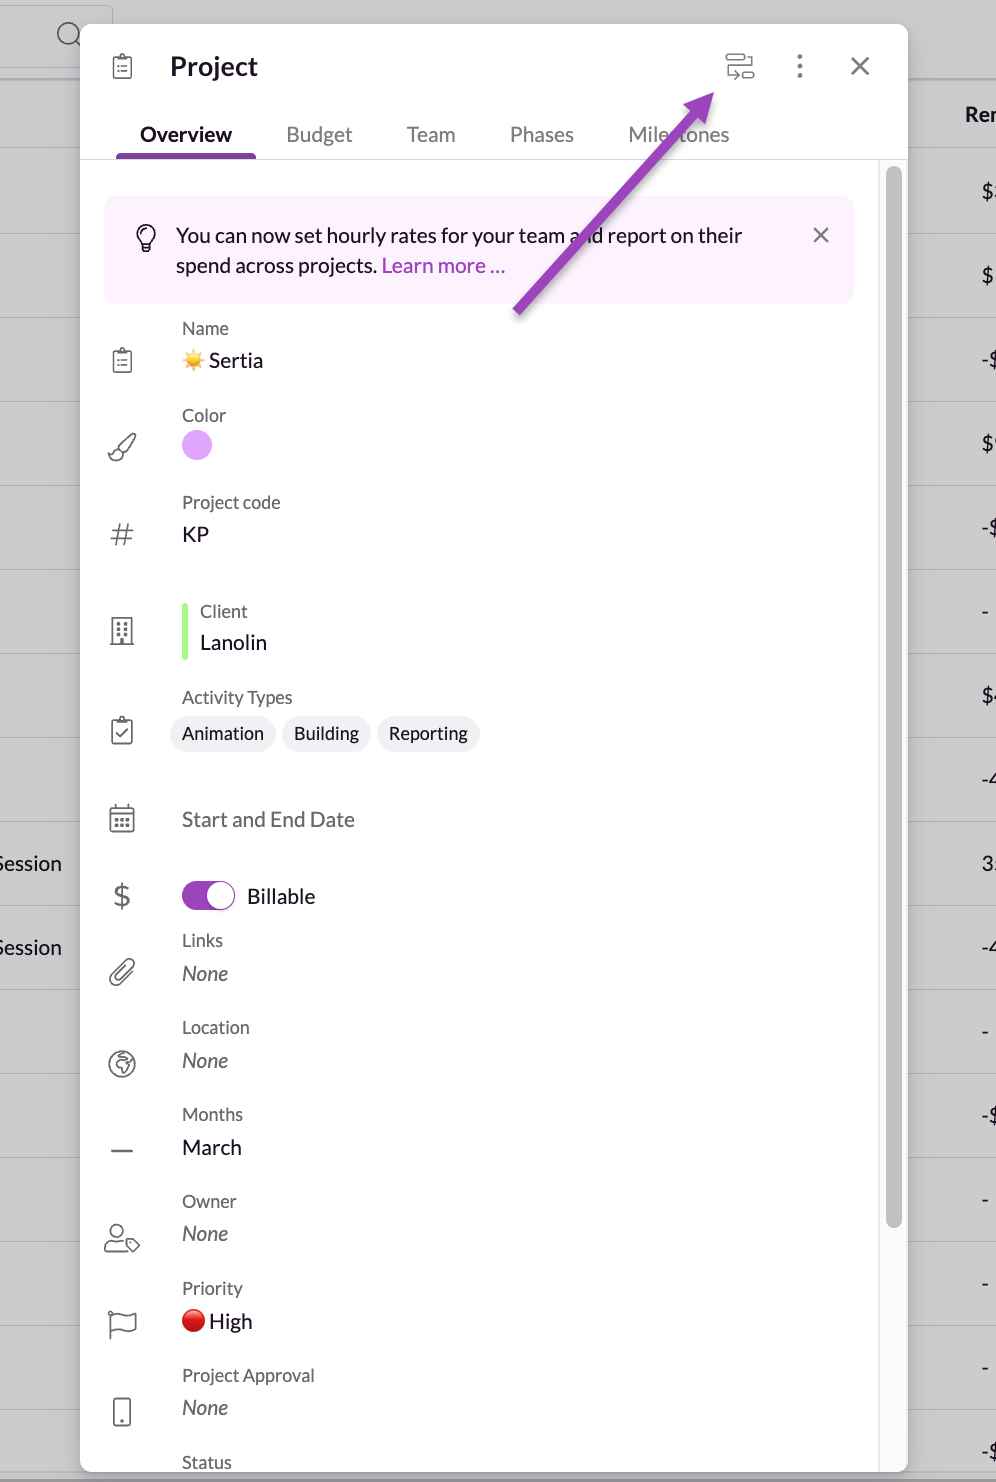
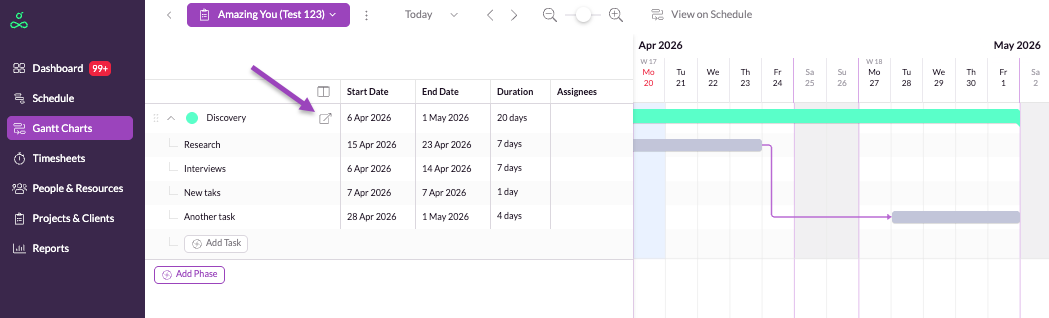
Alternatively, you can access Gantt charts from the Projects section by opening a project and clicking on the Gantt chart icon in the top right corner.
Adding Phases and Tasks
Click Add Phase to create a new stage of work. You can then add tasks within that phase.
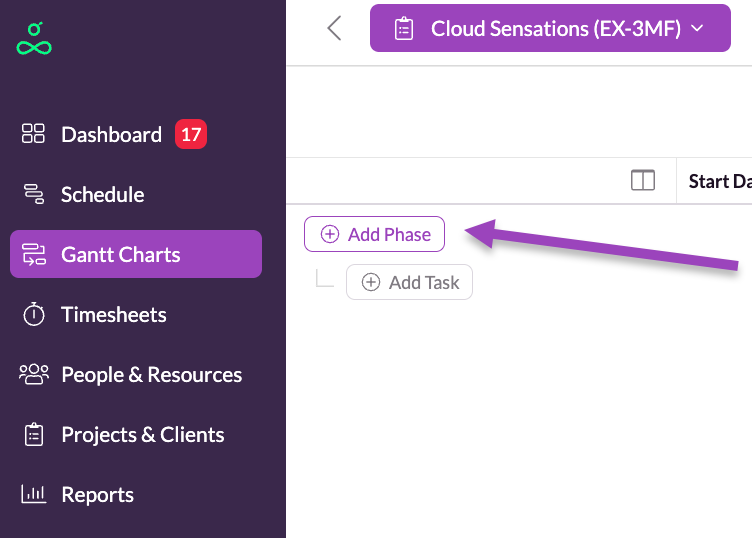
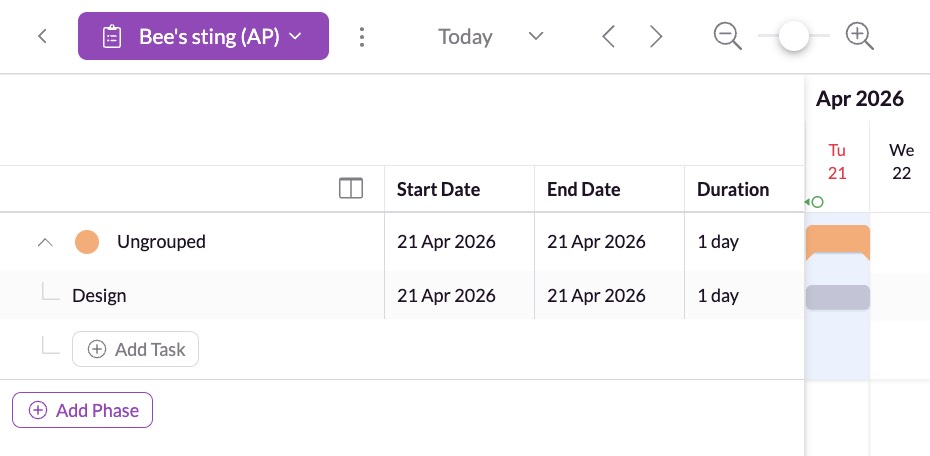
If you start by adding a task without specifying a phase first, it will be placed in an Ungrouped phase, which you can rename at any time.
As you add tasks or phases, pressing Enter on your keyboard will create the next item, allowing you to input a full plan in one flow. You can also use Tab to move between fields and update details.
Editing Phases and Tasks
Click on the phase or task bars directly or hover over their name and click on the details icon button. You can also use columns to manage these details. You can:
Change the color
Update dates
Add details/description/goal
Assign people
Manage dependencies

You can use drag and drop to move tasks between phases or to reorder tasks within a phase. Tasks can also be moved around on the timeline. This makes it simple to reshape your plan as priorities change.
The task duration is calculated based on the number of working days, so if a task covers a weekend, just like on the Schedule, the weekend days are skipped from that count.
Please note: we do not currently support task effort estimates—this feature is coming soon.
If a phase doesn’t contain any tasks, you can freely edit its start and end dates. This gives you flexibility to either plan at a high level or go into more detailed task breakdowns where needed.
When a phase contains tasks, the phase’s start and end dates are automatically determined by those tasks. This means you won’t be able to edit the phase duration directly—instead, you’ll need to adjust the tasks dates within it.
To hone in on specific dates, or to get a broader picture of the project plan, you can choose from four zoom levels.
Zooming in to the maximum level displays one week on the chart at a time, and zooming out to the minimum level lets you see the plan across a quarterly view.
Using Columns for More Details
You can display additional columns to manage your plan more efficiently.
Columns allow you to view and update key details such as start and end dates, duration (calculated using working days), and assignees. This makes it easier to update your plan without leaving the main view.
Please note: when you assign someone via the Gantt chart, they’re automatically added to the Project Team.
Dependencies between Tasks
Dependencies show how tasks relate to each other and help you keep your project on track.
Gantt charts currently supports finish-to-start dependencies, meaning one task must be completed before another can begin.
You can create a dependency in two ways: either drag the handle from one task to another directly on the timeline, or set it from within the task details.
In the task panel, you can add a predecessor (the task that comes before) or a successor (the task that follows):
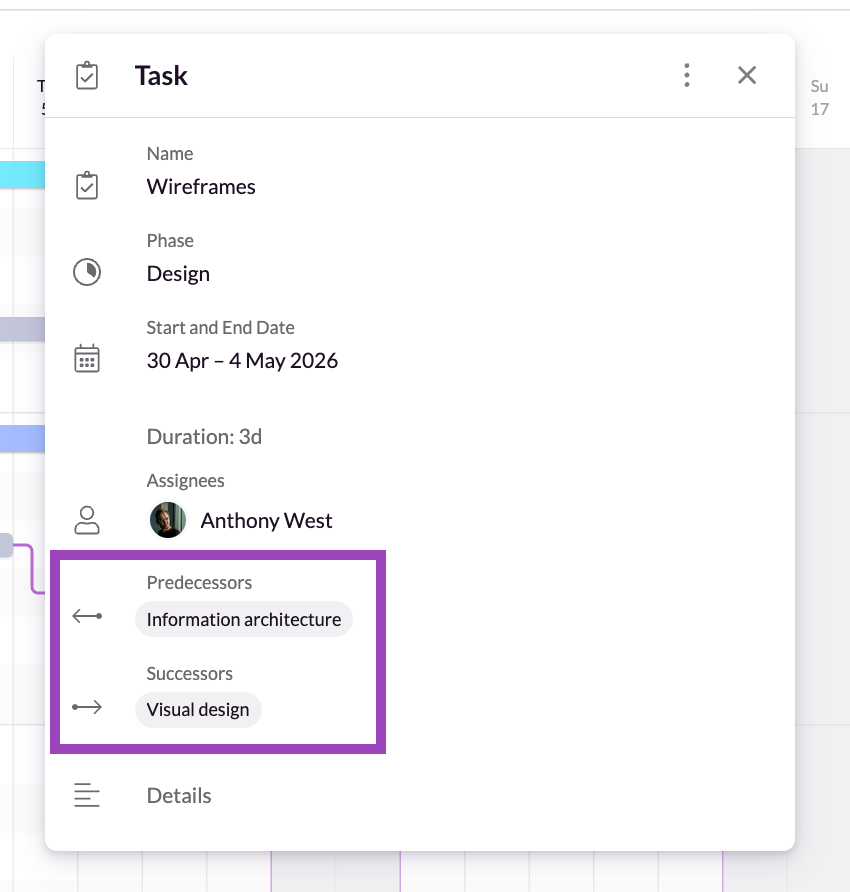
Once linked, the relationship is shown visually, and any dependent tasks will automatically adjust when changes are made.
You can remove a dependency by clicking on the arrow that connects the two tasks. You’ll be asked to confirm this to avoid accidental deletion.
Viewing Gantt Charts on the Schedule
Click View on Schedule to switch directly to the Schedule view for the same project.
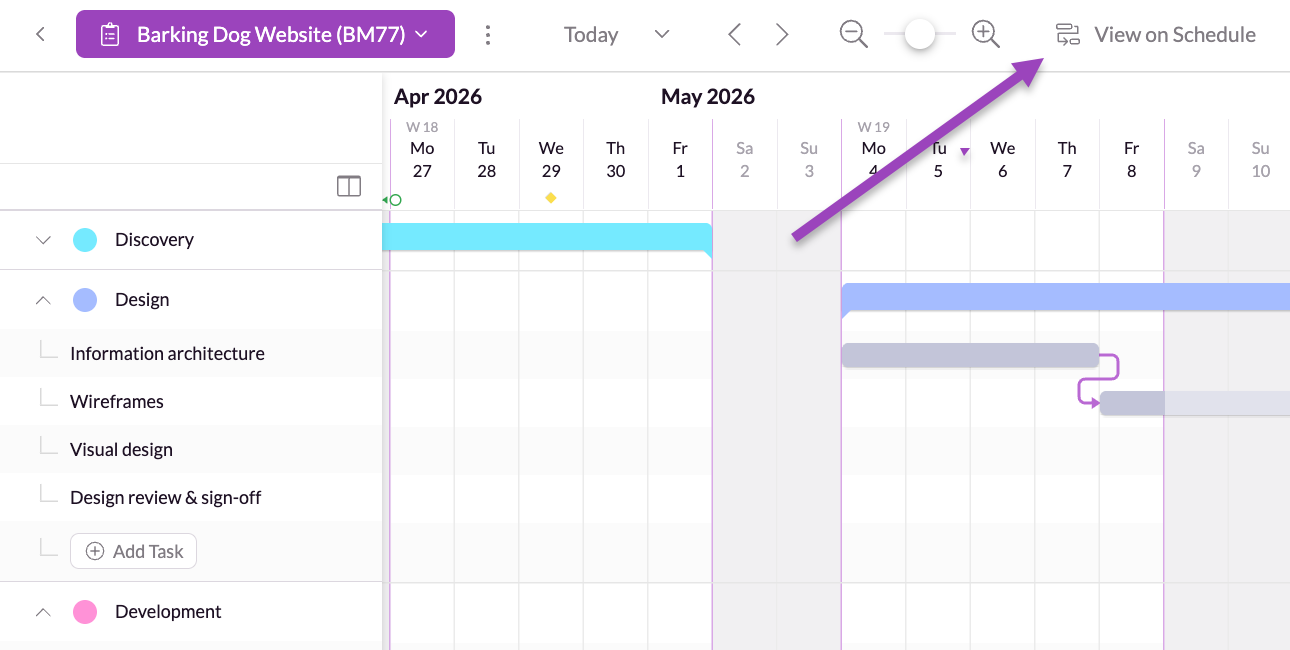
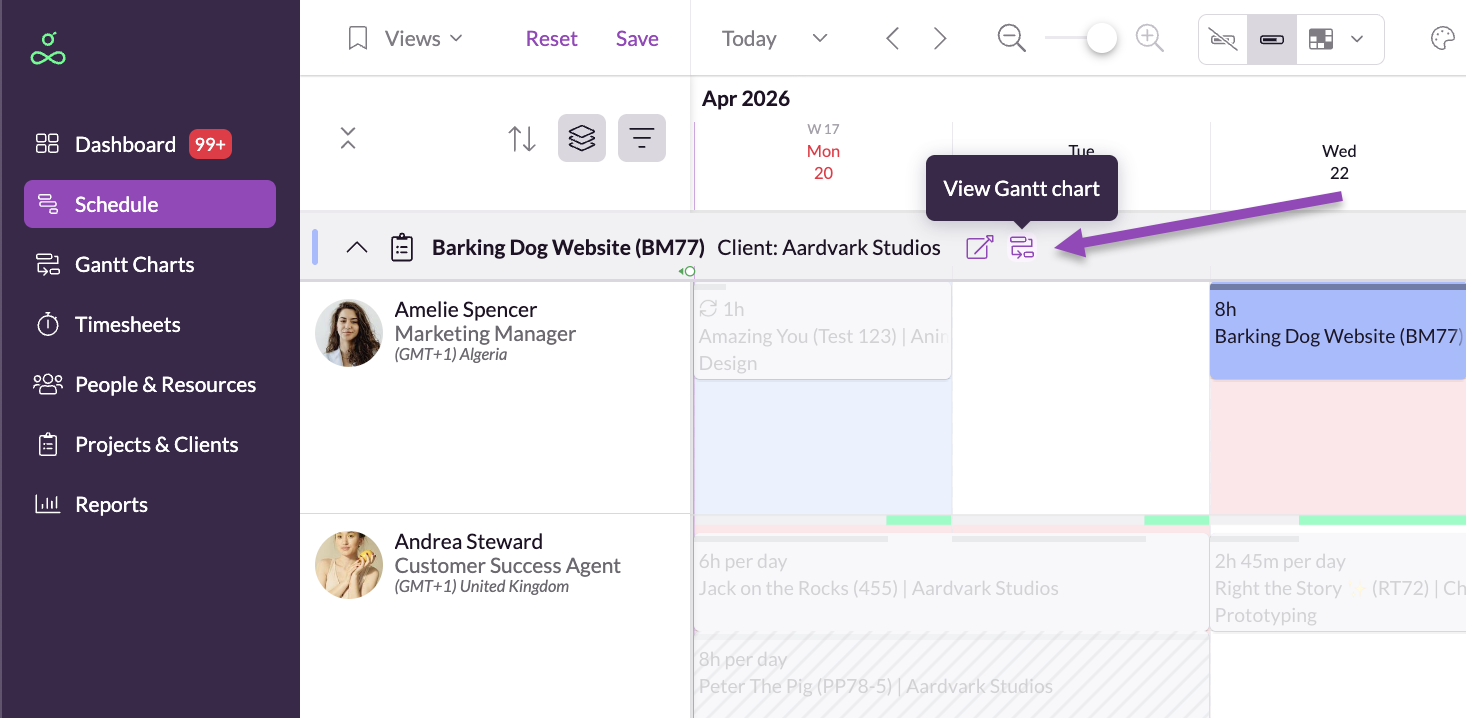
The Schedule will automatically be filtered and grouped to match your project, so you can continue planning or make adjustments. You can then jump back to the Gantt chart at any time by clicking on the View on Gantt Charts button by the name of your project.
Switching between Projects Gantt Charts
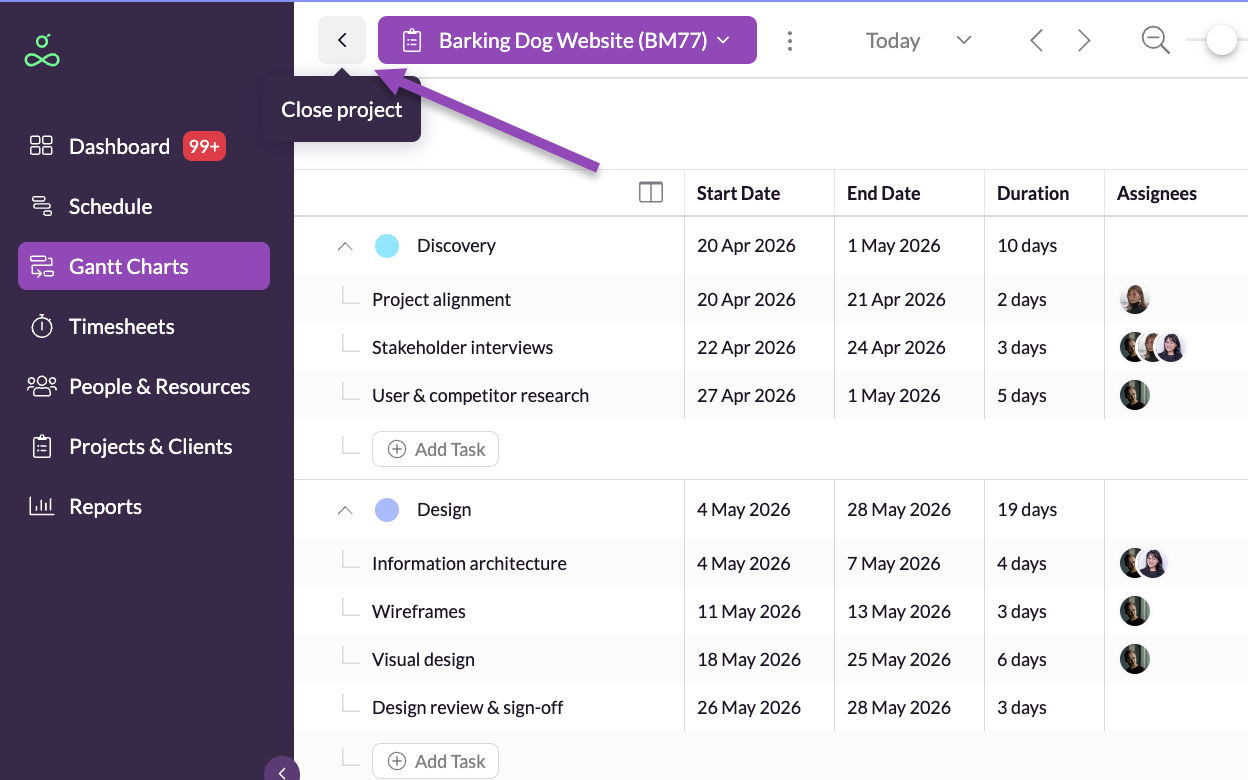
You can close the current project by clicking the < next to the project name in the top left corner. This won’t delete your plan—it simply takes you back to the Gantt Charts main page.
Sharing Gantt Charts externally
Public link sharing allows you to generate a read-only link to a project's Gantt chart. This link can be shared with anyone, including clients and external stakeholders who don't have a Resource Guru account.
The shared view provides a simple way to communicate project timelines without requiring recipients to sign in or collaborate within Resource Guru.
How it works:
Public link sharing creates a single read-only version of a project's Gantt chart that always reflects the latest saved state of the plan.
You can enable or disable sharing at any time from within the project. Each project has one reusable public link so you don’t have to manage multiple links or screenshots.
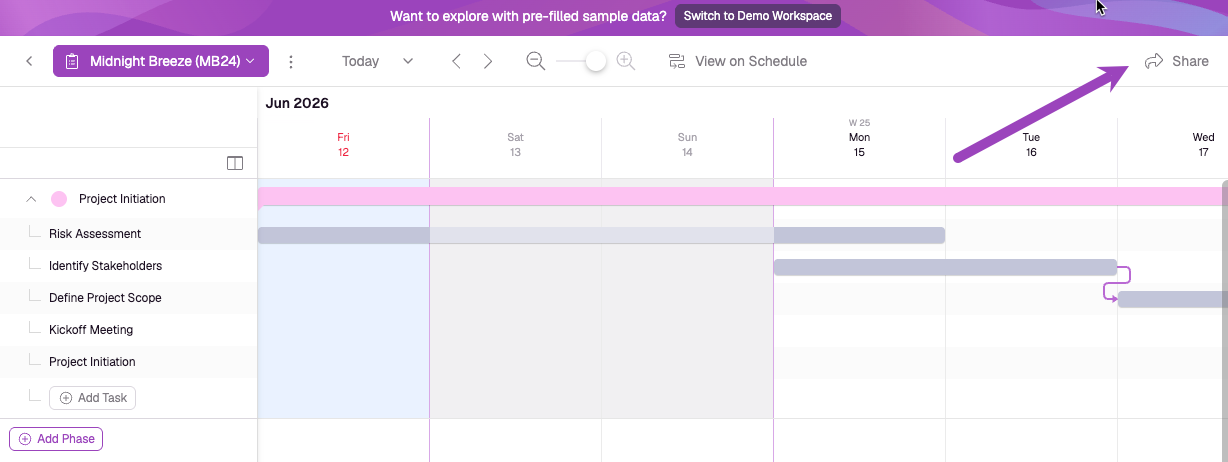
To create a public link, click Share in the top-right corner of the page.
After clicking on Share, a pop-up window will appear, allowing you to decide whether assignees are included in the shared view.
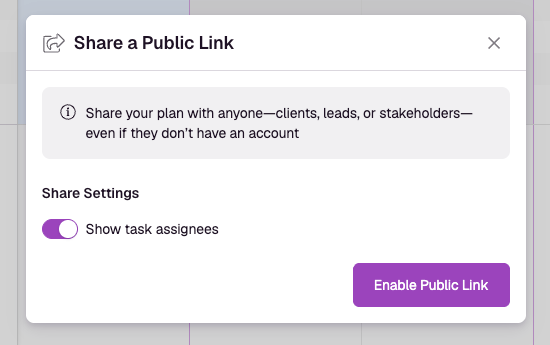
Recipients can view the project's phases, tasks, dependencies, and milestones, but cannot make any changes.
Because the shared page displays the latest saved version of the project, any changes made to the Gantt chart become visible after the shared page is refreshed. If sharing is disabled, or the project or account is no longer available, the public link will stop working.
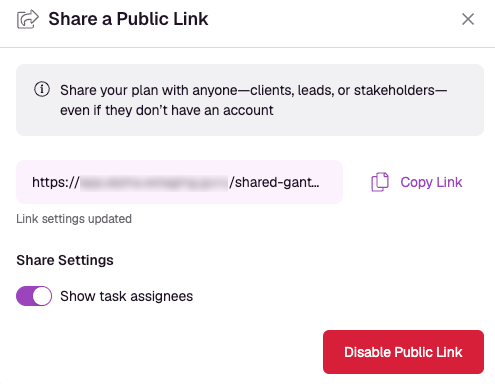
To disable the link, open the pop-up window at any time and click Disable Public Link:
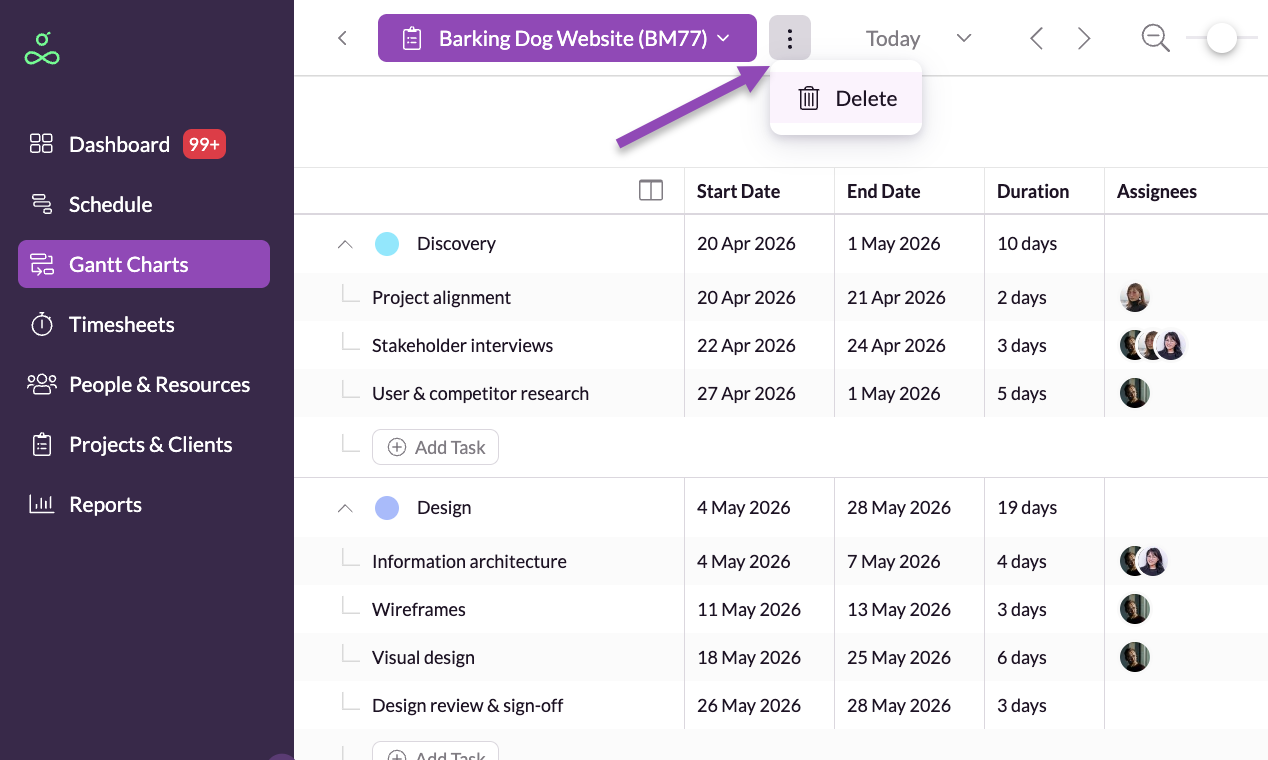
Deleting a Plan
If needed, you can delete all phases and tasks within a project’s Gantt chart by clicking on Delete in the kebab ⋮ menu.
This will clear the entire plan, but it won’t delete the project itself. You’ll be asked to confirm before anything is removed.
Mobile Access
Gantt charts are not yet available on mobile. This feature is coming soon.