
Exporting your Reports
If you like crunching your numbers, you can do that by downloading/exporting your reports in CSV format. When you download your reports, you’ll be given two options:
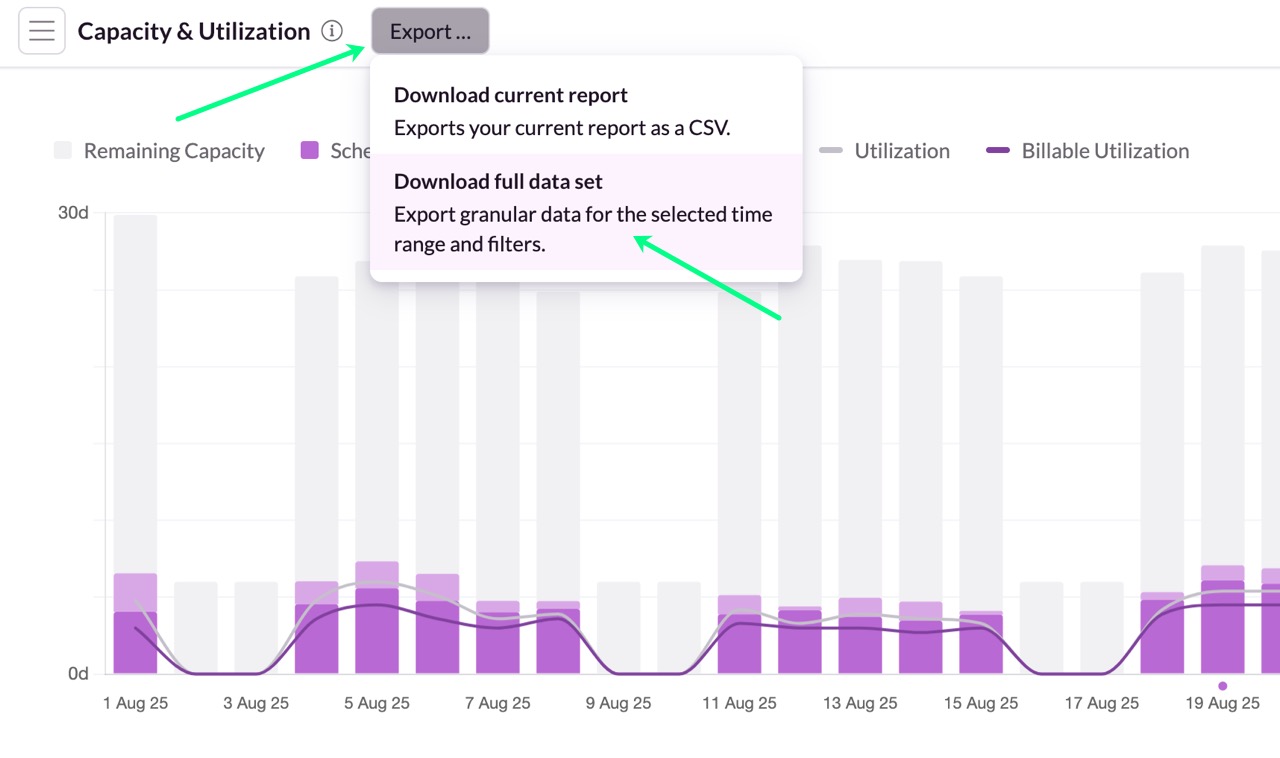
Downloading the current report (e.g. capacity-utilization report)
Downloading the full data set (including date range and filters)
With the first option, you’ll receive the current report in a single CSV file. With the second option, you’ll get seven CSV files containing the raw data as a direct download as well as via e-mail. Before clicking the download icon, please ensure you’ve selected the required date range and applied any relevant filters.
You will receive a zip file from which seven reports can be downloaded;
Availability Data (CSV)
Bookings Data (CSV)
Downtime Data (CSV)
Resource Data (CSV)
Utilization Data (CSV)
Scheduled Vs Actuals Data (CSV)
Timesheets Data (CSV)
You can copy/paste the data into other applications for further styling and editing.
Pivot tables are supported in Microsoft Excel, Google Sheets, and LibreOffice. For large data sets, we recommend using Excel, as that is the only application we've tested that can handle them reasonably well. Applications which cannot show pivot tables will still be able to display the raw data.
Guru tip
Details information is included in your Reports export.
When you download the Booking Data file, any notes or Markdown you’ve added to the Details field will be included.